Technical Analysis of FTAG 2024-05-31
Overview:
In analyzing the technical indicators for FTAG over the last 5 days, we will delve into the trend, momentum, volatility, and volume indicators to provide a comprehensive outlook on the possible stock price movement in the coming days. By examining these key aspects, we aim to offer valuable insights and predictions to guide your investment decisions.
Trend Indicators:
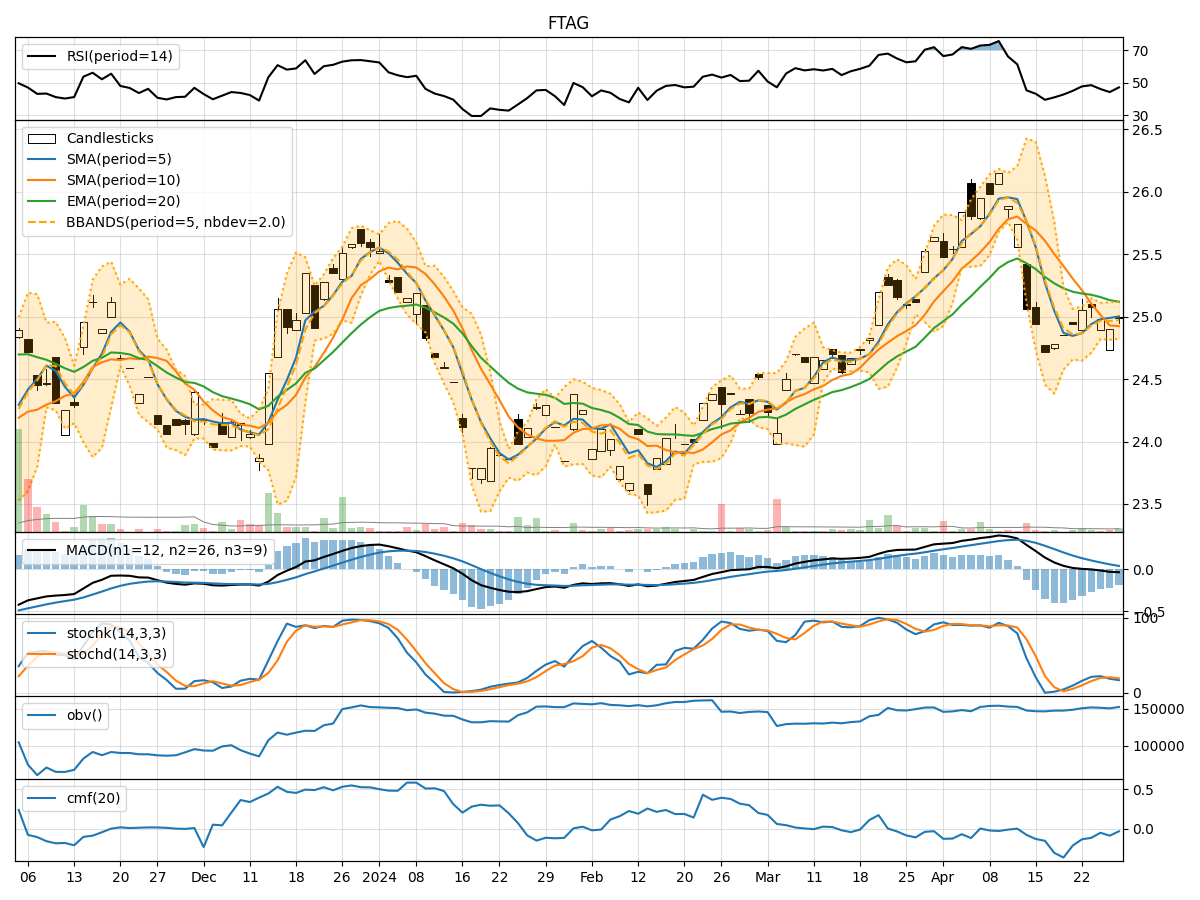
- Moving Averages (MA): The 5-day moving average has been declining gradually, indicating a short-term bearish trend.
- MACD (Moving Average Convergence Divergence): The MACD line has been consistently below the signal line, suggesting a bearish momentum.
- EMA (Exponential Moving Average): The EMA has also been trending downwards, aligning with the bearish sentiment in the short term.
Momentum Indicators:
- RSI (Relative Strength Index): The RSI has been fluctuating around the neutral zone, indicating indecision in the market.
- Stochastic Oscillator: Both %K and %D have been relatively low, signaling a lack of strong momentum.
- Williams %R (Willams Percentage Range): The indicator has been hovering in the oversold territory, suggesting a potential reversal.
Volatility Indicators:
- Bollinger Bands: The bands have been narrowing, indicating decreasing volatility in the stock price.
- Bollinger %B: The %B indicator has been fluctuating within a tight range, reflecting stability in price movements.
Volume Indicators:
- On-Balance Volume (OBV): The OBV has shown mixed signals, with fluctuations in volume accumulation.
- Chaikin Money Flow (CMF): The CMF has been relatively stable, indicating a neutral flow of money in and out of the stock.
Key Observations and Opinions:
- Trend: The trend indicators suggest a bearish sentiment in the short term.
- Momentum: Momentum indicators reflect a lack of strong buying or selling pressure.
- Volatility: Volatility indicators point towards decreasing price fluctuations.
- Volume: Volume indicators show mixed signals with no clear trend in accumulation or distribution.
Conclusion:
Based on the analysis of the technical indicators, the stock price of FTAG is likely to experience sideways movement in the coming days. The lack of strong trends in momentum, coupled with decreasing volatility and mixed volume signals, indicates a period of consolidation. Investors should exercise caution and closely monitor any potential breakout or reversal signals before making trading decisions.