Technical Analysis of FTHI 2024-05-31
Overview:
In analyzing the technical indicators for FTHI over the last 5 days, we will delve into the trend, momentum, volatility, and volume indicators to provide a comprehensive outlook on the possible stock price movement in the coming days. By examining these key indicators, we aim to offer valuable insights and predictions for potential investors.
Trend Analysis:
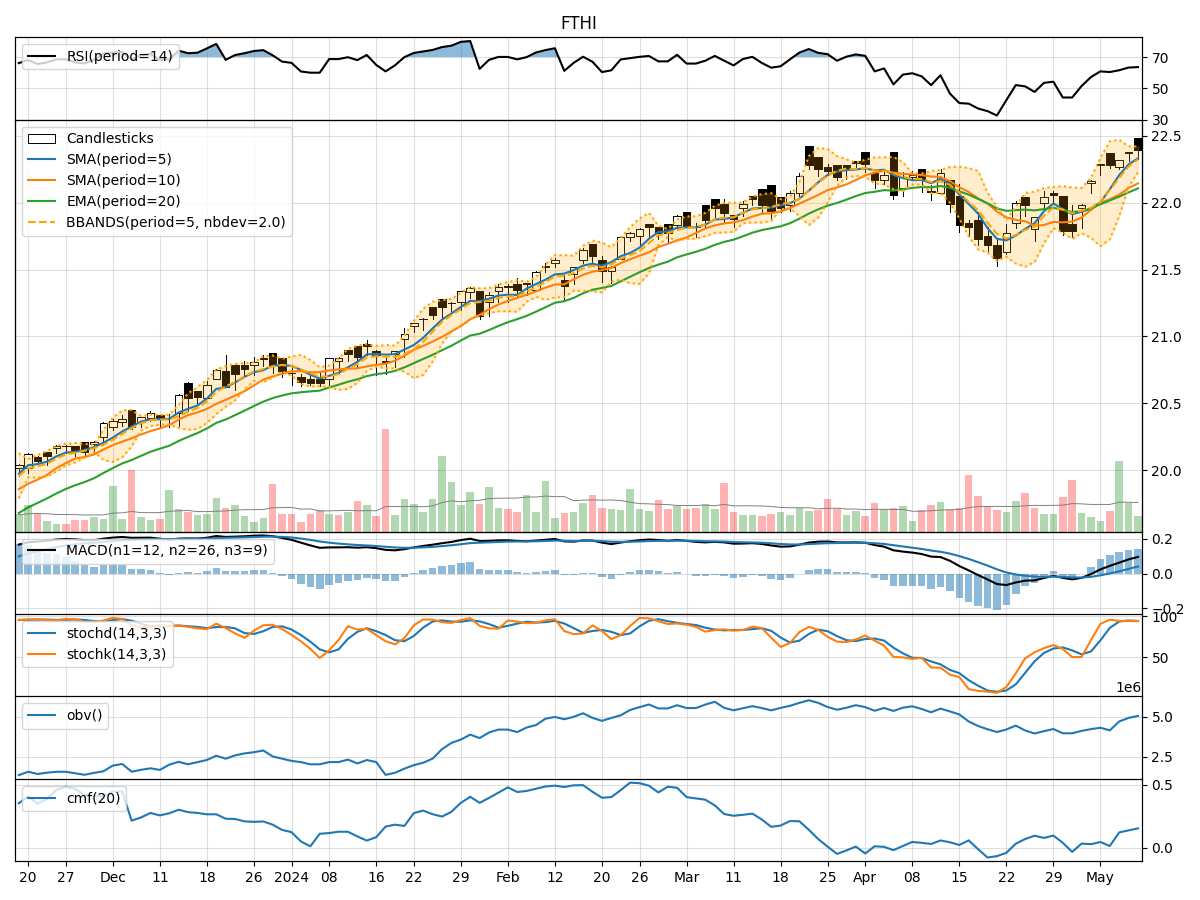
- Moving Averages (MA): The 5-day Moving Average (MA) has been hovering around the closing prices, indicating a relatively stable trend.
- MACD: The Moving Average Convergence Divergence (MACD) has shown a slight positive trend, with the MACD line consistently above the signal line.
- EMA: The Exponential Moving Average (EMA) has been gradually increasing, suggesting a bullish sentiment in the short term.
Key Observation: The trend indicators point towards a slightly bullish outlook for FTHI in the near future.
Momentum Analysis:
- RSI: The Relative Strength Index (RSI) has been fluctuating but generally staying within the neutral range, indicating a balanced momentum.
- Stochastic Oscillator: Both %K and %D have been declining, signaling a potential weakening momentum.
- Williams %R: The Williams %R has been oscillating in the oversold territory, suggesting a possible reversal.
Key Observation: The momentum indicators reflect a neutral to slightly bearish sentiment for FTHI in the upcoming days.
Volatility Analysis:
- Bollinger Bands (BB): The Bollinger Bands have been narrowing, indicating decreasing volatility in the stock price.
- BB %B: The %B indicator has been fluctuating within a tight range, reflecting stable price movements.
- BB Width: The Bollinger Bands Width has been contracting, suggesting a potential breakout or significant price movement ahead.
Key Observation: The volatility indicators imply a potential breakout or significant price movement on the horizon for FTHI.
Volume Analysis:
- On-Balance Volume (OBV): The OBV has shown mixed signals, with alternating positive and negative volume flows.
- Chaikin Money Flow (CMF): The CMF has been gradually increasing, indicating a positive money flow into the stock.
Key Observation: The volume indicators suggest mixed sentiment regarding the buying and selling pressure on FTHI.
Conclusion:
Based on the analysis of trend, momentum, volatility, and volume indicators, the overall outlook for FTHI in the next few days leans towards a sideways consolidation pattern with a slightly bullish bias. While the trend indicators point to a positive sentiment, the momentum indicators signal a neutral to bearish stance. The volatility indicators hint at a potential breakout, while the volume indicators show mixed signals.
In conclusion, FTHI is likely to experience sideways consolidation with a slight upward bias in the upcoming trading sessions. Investors should closely monitor key support and resistance levels for potential entry or exit points.