Technical Analysis of FXA 2024-05-31
Overview:
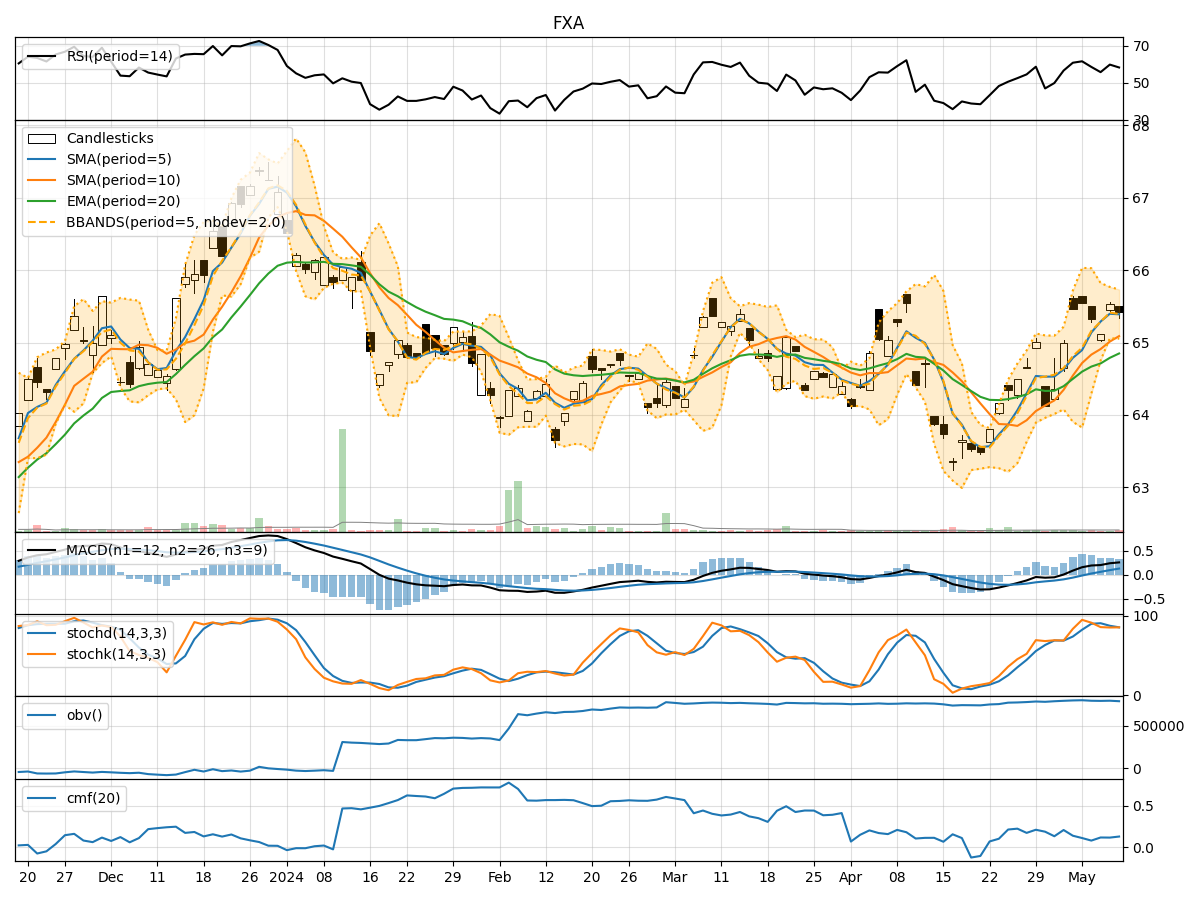
In analyzing the technical indicators for FXA over the last 5 days, we will delve into the trend, momentum, volatility, and volume indicators to provide a comprehensive assessment of the stock's potential price movement. By examining these key factors, we aim to offer valuable insights and predictions for the next few days.
Trend Analysis:
- Moving Averages (MA): The 5-day Moving Average (MA) has been fluctuating around the closing prices, indicating a relatively stable trend.
- MACD: The Moving Average Convergence Divergence (MACD) has shown positive values, suggesting a bullish momentum in the short term.
- EMA: The Exponential Moving Average (EMA) has been slightly increasing, reflecting a positive trend.
Key Observation: The trend indicators suggest a mildly bullish sentiment in the short term.
Momentum Analysis:
- RSI: The Relative Strength Index (RSI) has been oscillating around the mid-level, indicating a neutral momentum.
- Stochastic Oscillator: Both %K and %D have been declining, signaling a potential bearish momentum.
- Williams %R: The Williams %R is in the oversold territory, suggesting a possible reversal.
Key Observation: Momentum indicators are mixed, with a slight bearish bias.
Volatility Analysis:
- Bollinger Bands (BB): The Bollinger Bands have been narrowing, indicating decreasing volatility.
- Bollinger %B: The %B indicator has been hovering around the middle band, reflecting a balanced volatility level.
Key Observation: Volatility has been decreasing, potentially leading to a period of consolidation.
Volume Analysis:
- On-Balance Volume (OBV): The OBV has shown mixed movements, indicating indecision among market participants.
- Chaikin Money Flow (CMF): The CMF has been negative, suggesting a bearish money flow trend.
Key Observation: Volume indicators point towards a lack of strong conviction among traders.
Conclusion:
Based on the analysis of the technical indicators, the next few days for FXA are likely to see sideways movement with a slight bearish bias. The trend indicators suggest a mild bullish sentiment, while momentum indicators lean towards a bearish outlook. Volatility is decreasing, indicating a potential consolidation phase, and volume indicators reflect indecision in the market.
Key Conclusion: Expect sideways movement with a slight bearish bias in the next few days for FXA.