Technical Analysis of FXP 2024-05-31
Overview:
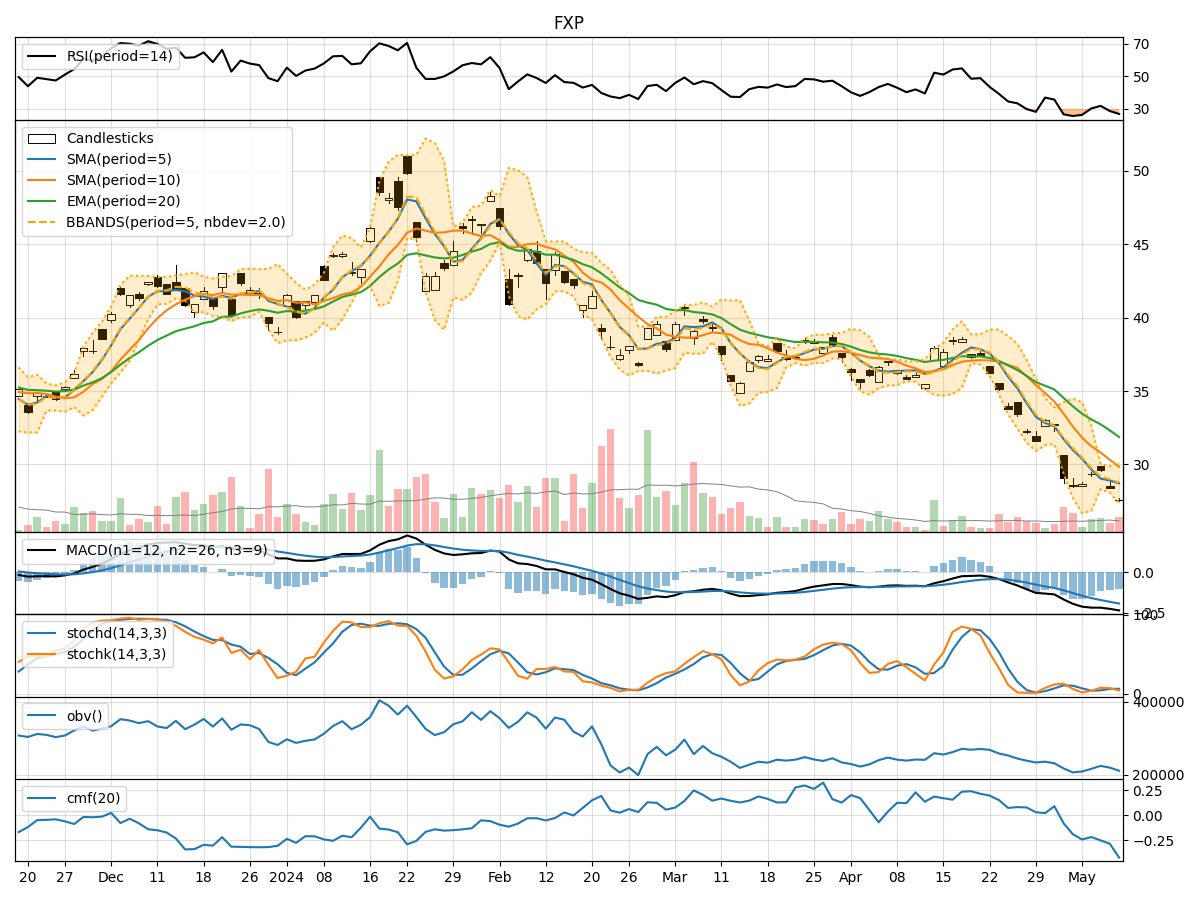
In analyzing the technical indicators for FXP over the last 5 days, we will delve into the trend, momentum, volatility, and volume indicators to provide a comprehensive outlook on the possible stock price movement in the coming days.
Trend Analysis:
- Moving Averages (MA): The 5-day Moving Average has been consistently rising, indicating a bullish trend.
- MACD: The MACD line has been increasing, with the MACD histogram also showing positive values, suggesting bullish momentum.
Momentum Analysis:
- RSI: The Relative Strength Index has been increasing, indicating strengthening bullish momentum.
- Stochastic Oscillator: Both %K and %D have been rising, signaling strong upward momentum.
Volatility Analysis:
- Bollinger Bands (BB): The stock price has been consistently trading above the middle Bollinger Band, indicating an uptrend with moderate volatility.
Volume Analysis:
- On-Balance Volume (OBV): The OBV has been fluctuating but generally trending downwards, suggesting some distribution.
- Chaikin Money Flow (CMF): The CMF has been negative, indicating selling pressure.
Key Observations:
- The trend indicators, momentum indicators, and volatility indicators all point towards a bullish outlook for FXP.
- However, the volume indicators show some signs of distribution and selling pressure.
Conclusion:
Based on the analysis of the technical indicators, the next few days for FXP are likely to see a continuation of the bullish trend with increased momentum and moderate volatility. However, caution is advised due to the negative OBV and CMF, which suggest some selling pressure in the market. Traders should monitor the volume closely for any signs of a potential trend reversal. Overall, the outlook for FXP remains bullish in the near term.