Technical Analysis of FXY 2024-05-10
Overview:
In analyzing the technical indicators for FXY over the last 5 days, we will delve into the trend, momentum, volatility, and volume indicators to provide a comprehensive outlook on the possible stock price movement in the coming days. By examining these key aspects, we aim to offer valuable insights and predictions for informed decision-making.
Trend Analysis:
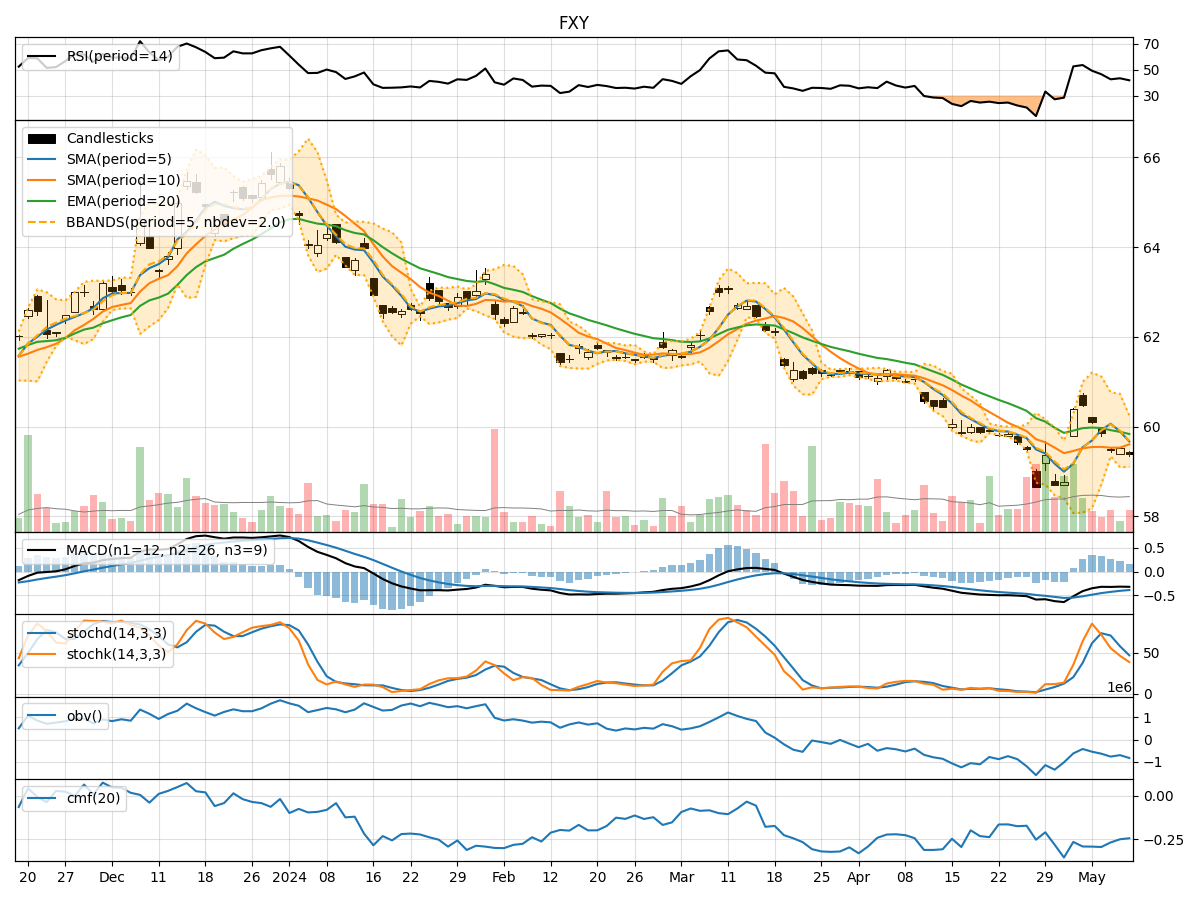
- Moving Averages (MA): The 5-day MA has been fluctuating around the actual closing prices, indicating a lack of clear trend direction.
- MACD: The MACD line has been consistently below the signal line, suggesting a bearish momentum in the short term.
- EMA: The EMA has been gradually decreasing, reflecting a downward trend in the stock price.
Momentum Analysis:
- RSI: The RSI values have been declining, indicating a weakening momentum and potential oversold conditions.
- Stochastic Oscillator: Both %K and %D values have been decreasing, signaling a bearish momentum.
- Williams %R: The Williams %R values have been consistently in the oversold territory, suggesting a potential reversal or bounce.
Volatility Analysis:
- Bollinger Bands (BB): The stock price has been trading within the lower Bollinger Band, indicating a potential oversold condition.
- BB Width: The Bollinger Band width has been narrowing, suggesting a decrease in volatility.
- BB %B: The %B indicator has been hovering around the lower band, indicating a possible bounce or reversal.
Volume Analysis:
- On-Balance Volume (OBV): The OBV values have been declining, indicating a potential distribution phase.
- Chaikin Money Flow (CMF): The CMF values have been negative, suggesting a lack of buying pressure and potential bearish sentiment.
Conclusion:
Based on the analysis of the technical indicators, the stock price of FXY is likely to experience further downward movement in the coming days. The bearish trend indicated by the MACD, EMA, RSI, and Stochastic Oscillator, coupled with the narrowing Bollinger Bands and negative OBV and CMF values, all point towards a bearish outlook. Traders and investors should exercise caution and consider shorting or staying on the sidelines until a clear reversal pattern emerges.
Key Takeaways:
- Bearish Bias: The overall technical indicators suggest a bearish sentiment in the short term.
- Oversold Conditions: The stock may be approaching oversold levels, potentially signaling a reversal opportunity.
- Risk Management: Traders should implement proper risk management strategies to mitigate potential losses in a volatile market environment.
By carefully monitoring these indicators and staying informed about market developments, investors can make well-informed decisions aligned with the prevailing market trends.