Technical Analysis of FYLD 2024-05-31
Overview:
In analyzing the technical indicators for FYLD over the last 5 days, we will delve into the trend, momentum, volatility, and volume indicators to provide a comprehensive outlook on the possible stock price movement in the coming days.
Trend Analysis:
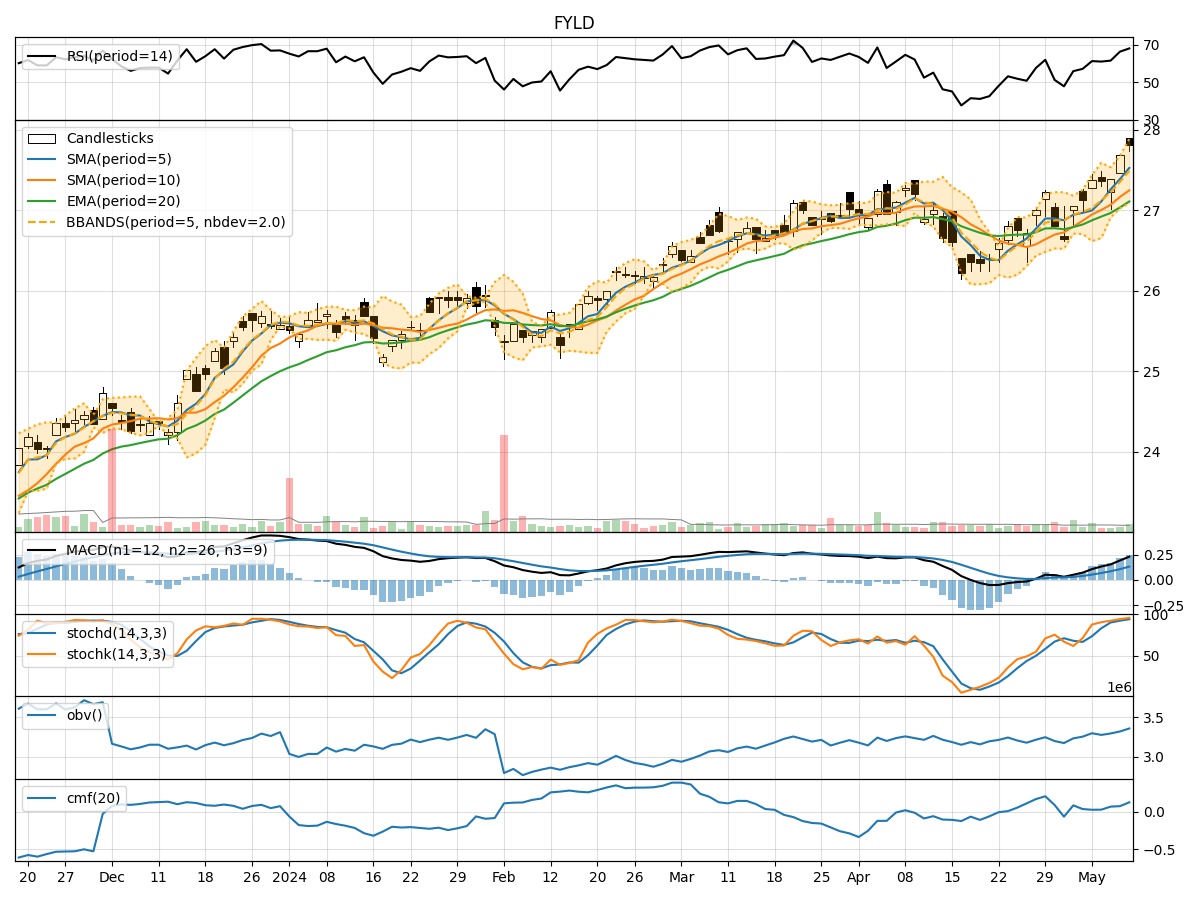
- Moving Averages (MA): The 5-day Moving Average (MA) has been fluctuating around the closing prices, indicating short-term price trends. The Simple Moving Average (SMA) and Exponential Moving Average (EMA) show a slight upward trend.
- MACD: The Moving Average Convergence Divergence (MACD) has been positive, suggesting bullish momentum in the stock price.
Momentum Analysis:
- RSI: The Relative Strength Index (RSI) has been hovering around the neutral zone, indicating neither overbought nor oversold conditions.
- Stochastic Oscillator: Both %K and %D have been fluctuating, showing indecision in momentum.
Volatility Analysis:
- Bollinger Bands (BB): The Bollinger Bands have been relatively narrow, suggesting low volatility in the stock price.
Volume Analysis:
- On-Balance Volume (OBV): The OBV has shown a slight increase, indicating some buying pressure.
- Chaikin Money Flow (CMF): The CMF has been positive, reflecting accumulation in the stock.
Key Observations:
- The stock has been trading within a narrow range with slight upward momentum.
- Volatility has been low, indicating a lack of significant price fluctuations.
- Volume has shown some increase, suggesting potential interest from buyers.
Conclusion:
Based on the analysis of the technical indicators, the stock of FYLD is likely to continue trading sideways with a slight upward bias in the next few days. The bullish momentum indicated by the MACD and the positive OBV and CMF suggest that buyers are still interested in the stock. However, the lack of strong trends in moving averages and oscillators like RSI and Stochastic indicates a consolidation phase.
Recommendation:
- Short-term traders: Consider taking advantage of the sideways movement by trading within the range.
- Long-term investors: Monitor the stock for a clearer trend confirmation before making significant investment decisions.
In conclusion, while the stock shows signs of bullish momentum and buying interest, the overall trend is likely to remain sideways with a slight upward bias in the coming days.