Technical Analysis of GAST 2024-05-31
Overview:
In analyzing the technical indicators for GAST stock over the last 5 days, we will delve into the trend, momentum, volatility, and volume indicators to provide a comprehensive outlook on the possible stock price movement in the coming days. By examining key metrics such as moving averages, MACD, RSI, Bollinger Bands, and OBV, we aim to offer valuable insights and predictions for potential price action.
Trend Indicators:
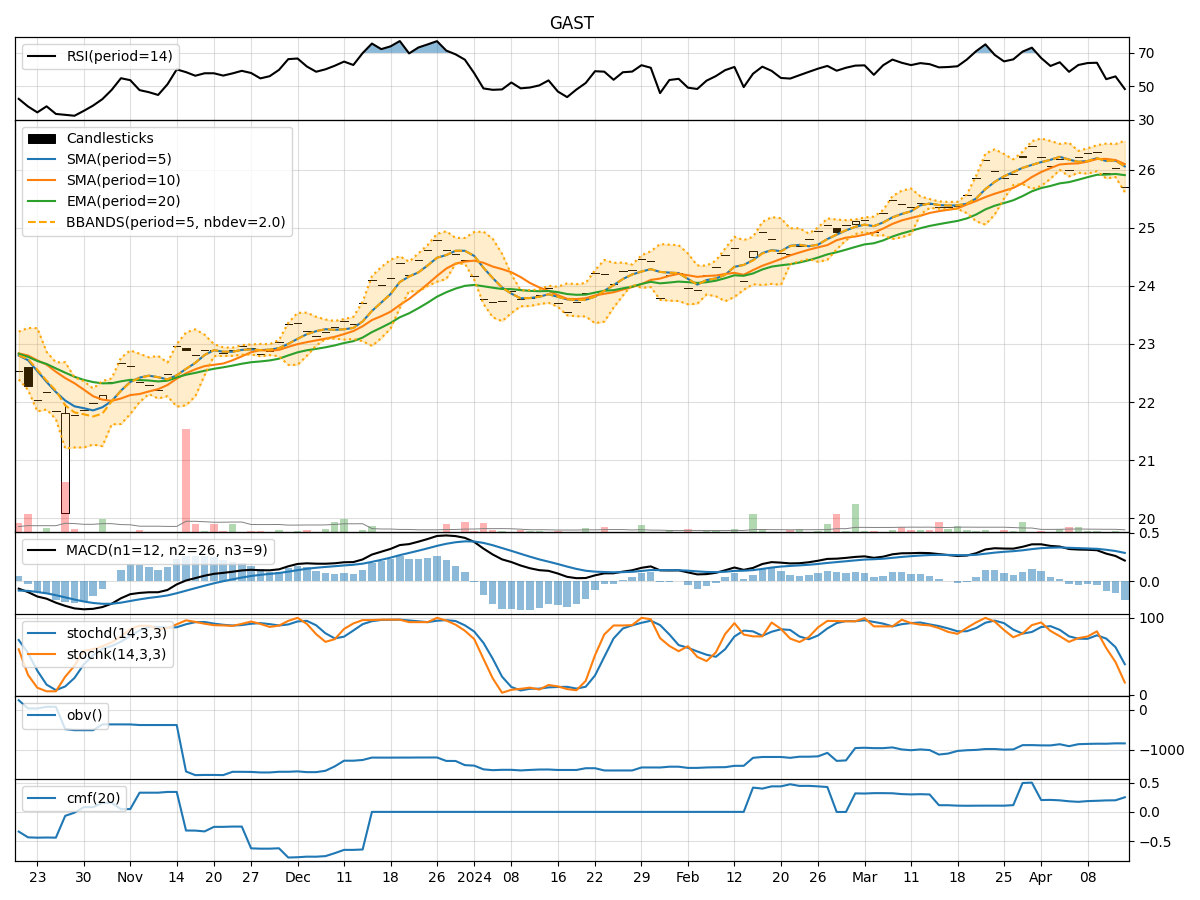
- Moving Averages (MA): The 5-day MA has been gradually decreasing, indicating a short-term bearish trend.
- MACD: The MACD line has been positive but decreasing, while the MACD Histogram has been moving towards the zero line, suggesting a potential reversal.
- EMA: The EMA has been relatively stable, reflecting a neutral trend.
Momentum Indicators:
- RSI: The RSI has been fluctuating around the mid-level, indicating indecision in the market.
- Stochastic Oscillator: Both %K and %D have been declining, signaling a potential bearish momentum.
- Williams %R: The indicator has been in oversold territory, suggesting a possible reversal to the upside.
Volatility Indicators:
- Bollinger Bands: The stock price has been trading within the bands, with the bands narrowing, indicating reduced volatility.
- Bollinger %B: The %B has been hovering around the middle, reflecting a balanced market sentiment.
Volume Indicators:
- On-Balance Volume (OBV): The OBV has been relatively flat, indicating a lack of significant buying or selling pressure.
- Chaikin Money Flow (CMF): The CMF has been negative, suggesting a net outflow of money from the stock.
Key Observations and Opinions:
- Trend: The trend indicators show a mixed picture, with a slight bearish bias in the short term.
- Momentum: Momentum indicators suggest a weakening bullish momentum and a potential shift towards bearish sentiment.
- Volatility: Volatility has been decreasing, indicating a possible period of consolidation or range-bound trading.
- Volume: Volume indicators point to a lack of strong conviction from market participants.
Conclusion:
Based on the analysis of the technical indicators, the next few days for GAST stock are likely to see sideways movement with a slight bearish bias. Traders should exercise caution and wait for clearer signals before making significant trading decisions. It is advisable to monitor key levels such as support and resistance for potential breakout or breakdown scenarios.