Technical Analysis of GGUS 2024-05-31
Overview:
In analyzing the technical indicators for GGUS over the last 5 days, we will delve into the trend, momentum, volatility, and volume indicators to provide a comprehensive outlook on the possible stock price movement in the coming days. By examining these key aspects, we aim to offer valuable insights and predictions for informed decision-making.
Trend Indicators:
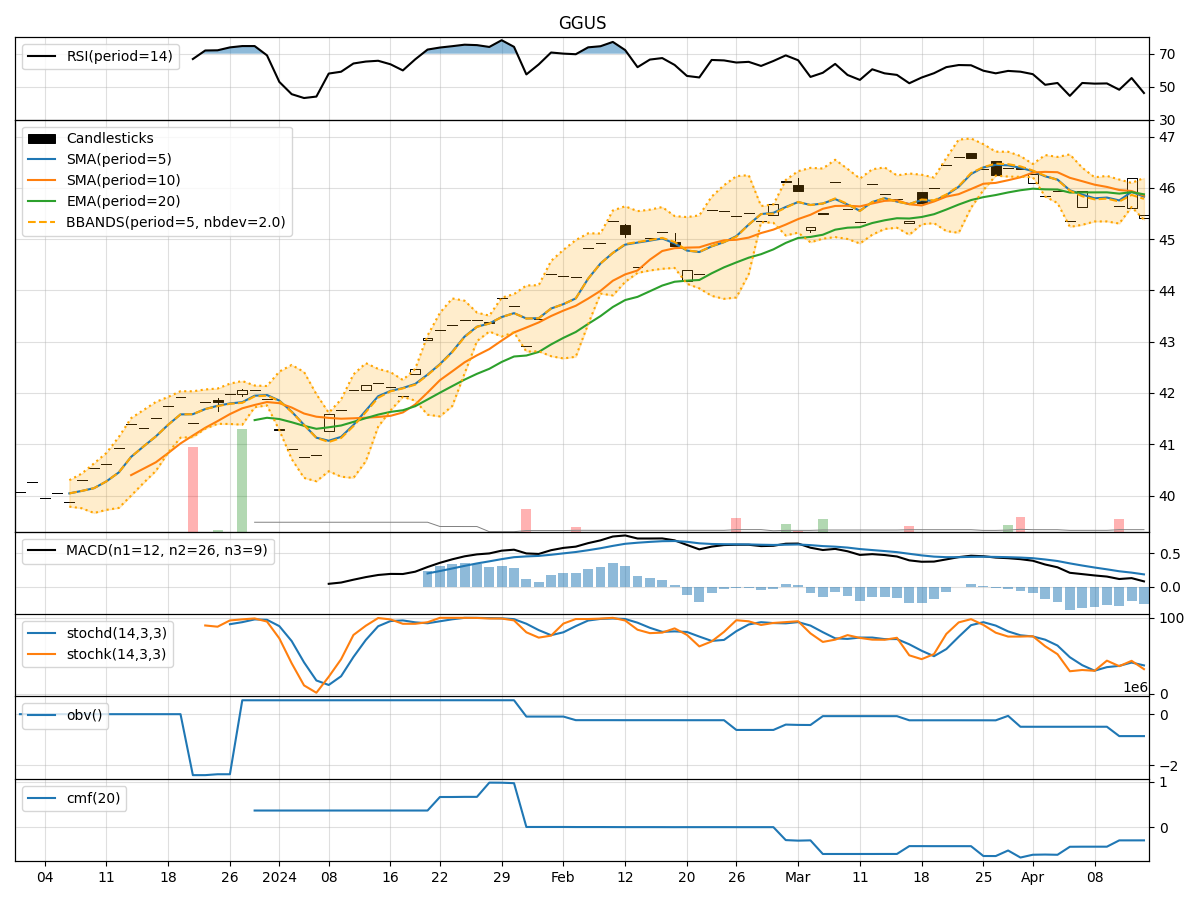
- Moving Averages (MA): The 5-day MA has been fluctuating around the closing prices, indicating short-term price trends. The SMA(10) and EMA(20) have shown a slight upward trend, suggesting potential bullish momentum.
- MACD: The MACD line has been positive, indicating a bullish trend, although the MACD Histogram has shown a slight decrease in bullish momentum.
- Conclusion: The trend indicators suggest a slightly bullish outlook for the stock price.
Momentum Indicators:
- RSI: The RSI has been fluctuating in the neutral zone, indicating indecision in the market sentiment.
- Stochastic Oscillator: Both %K and %D have been declining, suggesting a potential reversal in momentum.
- Williams %R: The indicator has been in oversold territory, indicating a possible buying opportunity.
- Conclusion: The momentum indicators point towards a neutral to slightly bearish sentiment.
Volatility Indicators:
- Bollinger Bands: The stock price has been trading within the bands, with the bands widening, indicating increased volatility.
- Conclusion: The volatility indicators suggest increased volatility in the stock price.
Volume Indicators:
- On-Balance Volume (OBV): The OBV has shown mixed signals, with a slight increase in volume on the last trading day.
- Chaikin Money Flow (CMF): The CMF has been steadily increasing, indicating buying pressure.
- Conclusion: The volume indicators suggest mixed signals in terms of volume accumulation.
Overall Conclusion:
Based on the analysis of the technical indicators, the stock price of GGUS is likely to experience increased volatility in the coming days. The trend indicators point towards a slightly bullish outlook, while momentum indicators suggest a neutral to slightly bearish sentiment. The volume indicators provide mixed signals regarding volume accumulation.
Recommendation:
Considering the overall analysis, it is advisable to proceed with caution and closely monitor the stock price movement. Traders may consider implementing risk management strategies to navigate the increased volatility. Long-term investors may find potential opportunities in the bullish trend indicated by the trend indicators. However, it is essential to remain vigilant and adapt to changing market conditions.
Disclaimer:
Please note that technical analysis is not a guaranteed predictor of future price movements, and other fundamental factors can influence stock prices. It is crucial to conduct thorough research and consider multiple indicators before making any investment decisions. Consulting with a financial advisor is recommended for personalized investment advice tailored to individual goals and risk tolerance levels.