Technical Analysis of GLOF 2024-05-31
Overview:
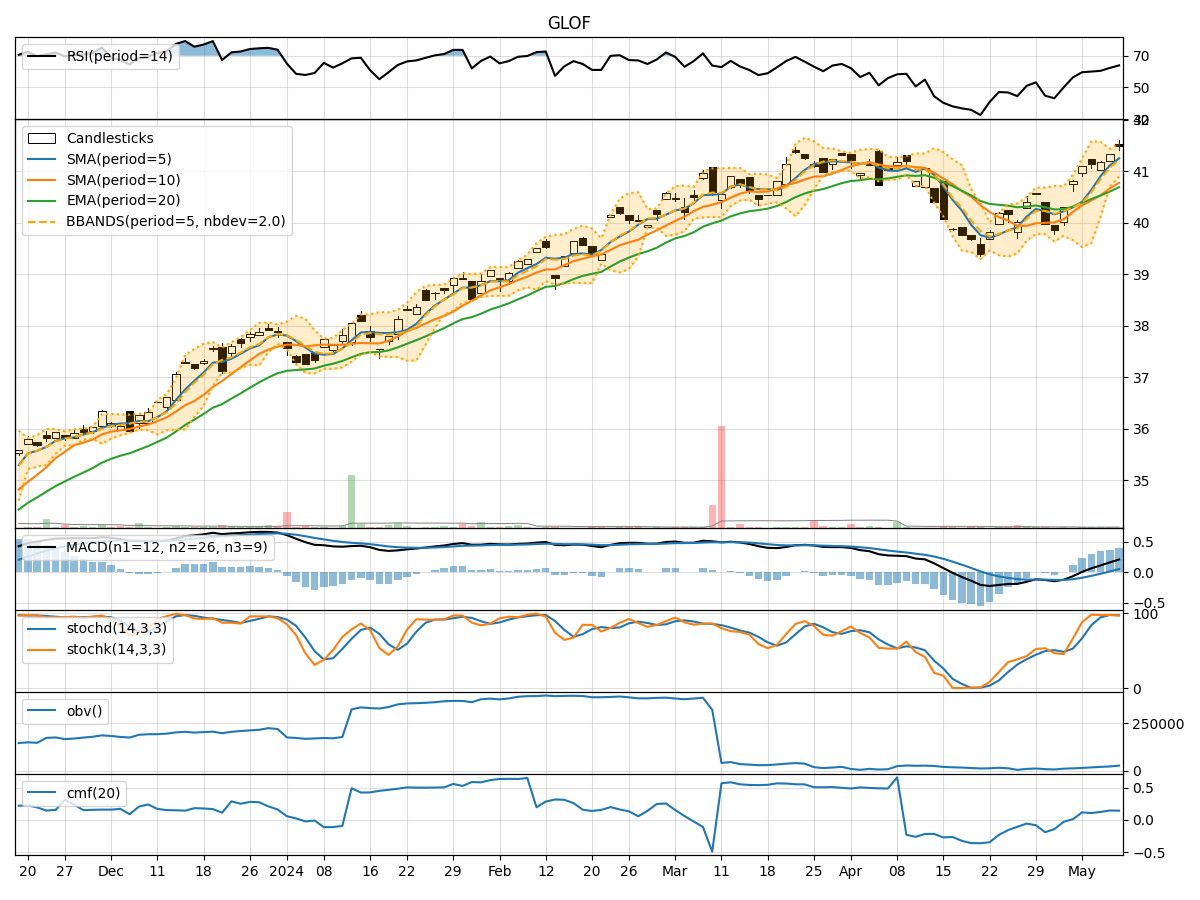
In analyzing the technical indicators for GLOF stock over the last 5 days, we will delve into the trend, momentum, volatility, and volume indicators to provide a comprehensive outlook on the possible stock price movement in the coming days. By examining these key indicators, we aim to offer valuable insights and predictions to guide your investment decisions.
Trend Analysis:
- Moving Averages (MA): The 5-day Moving Average (MA) has been fluctuating around the closing prices, indicating a relatively stable trend.
- MACD: The Moving Average Convergence Divergence (MACD) has shown a slight decrease over the past 5 days, suggesting a weakening bullish momentum.
- RSI: The Relative Strength Index (RSI) has been declining, indicating a potential shift towards bearish sentiment.
Momentum Analysis:
- Stochastic Oscillator: Both %K and %D values have been decreasing, signaling a loss in momentum.
- Williams %R: The Williams %R indicator has been in the oversold territory, suggesting a potential reversal or consolidation.
Volatility Analysis:
- Bollinger Bands (BB): The Bollinger Bands have been narrowing, indicating decreasing volatility in the stock price.
- Average True Range (ATR): The ATR values have been relatively stable, suggesting consistent price movements.
Volume Analysis:
- On-Balance Volume (OBV): The OBV has been declining, indicating selling pressure in the stock.
- Chaikin Money Flow (CMF): The CMF has been negative, suggesting outflow of money from the stock.
Key Observations:
- The trend indicators show a potential weakening in the bullish trend.
- Momentum indicators point towards a loss in upward momentum.
- Volatility indicators suggest decreasing price fluctuations.
- Volume indicators indicate selling pressure and outflow of money from the stock.
Conclusion:
Based on the analysis of the technical indicators, the stock price of GLOF is likely to experience a downward movement in the coming days. The weakening trend, loss of momentum, decreasing volatility, and negative volume indicators all point towards a bearish outlook. Investors should exercise caution and consider potential short-term selling opportunities or wait for a clearer signal before entering a long position.