Technical Analysis of GMUN 2024-05-31
Overview:
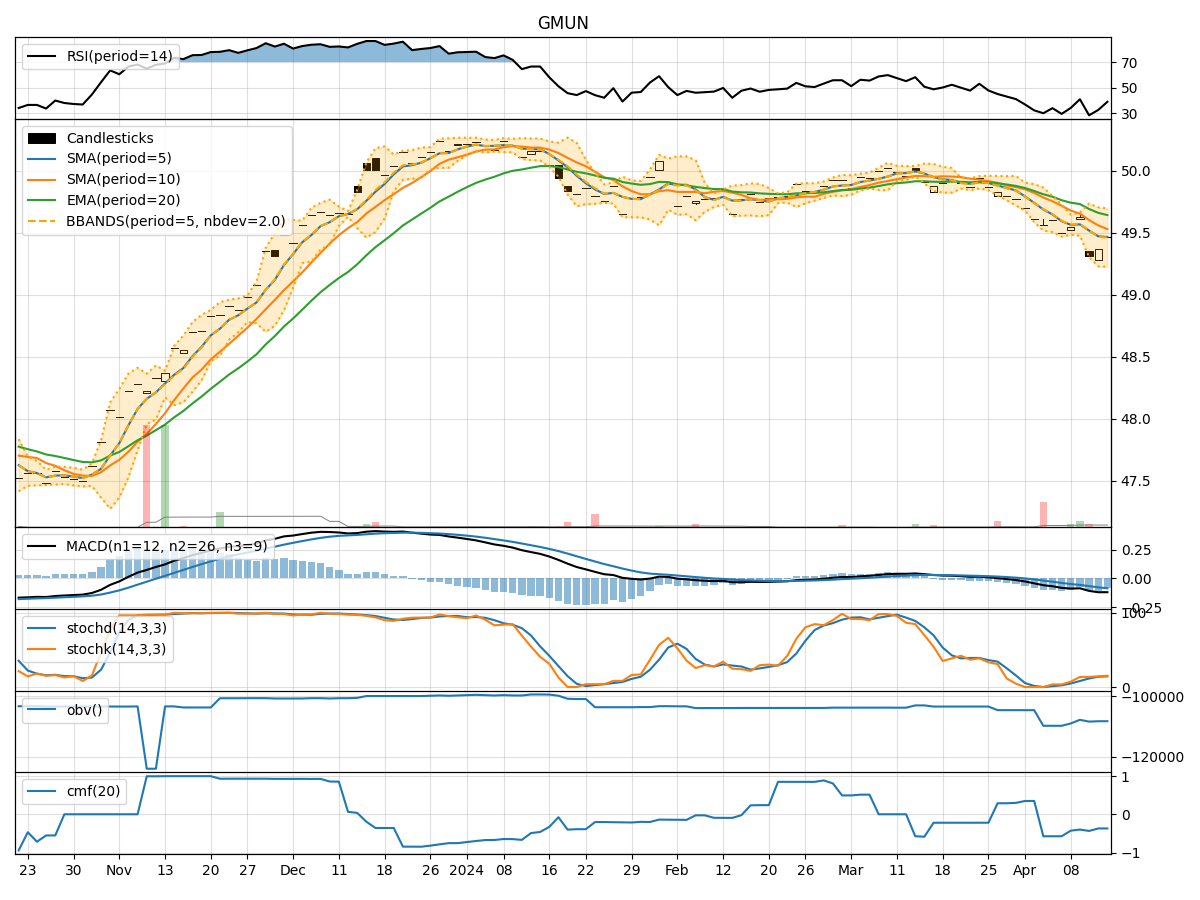
In analyzing the technical indicators for GMUN over the last 5 days, we will delve into the trend, momentum, volatility, and volume indicators to provide a comprehensive outlook on the possible stock price movement in the coming days.
Trend Analysis:
- Moving Averages (MA): The 5-day MA has been consistently below the closing price, indicating a short-term downtrend.
- MACD: The MACD line has been negative, with the MACD histogram showing a decreasing trend, signaling a potential bearish momentum.
Momentum Analysis:
- RSI: The RSI has been below 30, indicating oversold conditions and a potential reversal in the stock price.
- Stochastic Oscillator: Both %K and %D have been low, suggesting a bearish momentum.
Volatility Analysis:
- Bollinger Bands (BB): The stock price has been trading within the lower Bollinger Band, indicating a potential oversold condition.
Volume Analysis:
- On-Balance Volume (OBV): The OBV has been decreasing, suggesting selling pressure in the stock.
- Chaikin Money Flow (CMF): The CMF has been negative, indicating a bearish money flow.
Key Observations:
- The stock is currently in a short-term downtrend based on moving averages and MACD.
- Momentum indicators suggest oversold conditions but still show a bearish bias.
- Volatility indicators point towards potential oversold conditions.
- Volume indicators reflect selling pressure and bearish money flow.
Conclusion:
Based on the analysis of technical indicators, the stock is likely to experience further downward movement in the coming days. The trend, momentum, volatility, and volume indicators collectively suggest a bearish outlook for GMUN. Traders and investors should exercise caution and consider waiting for more definitive signs of a reversal before considering long positions.