Technical Analysis of GOLY 2024-05-31
Overview:
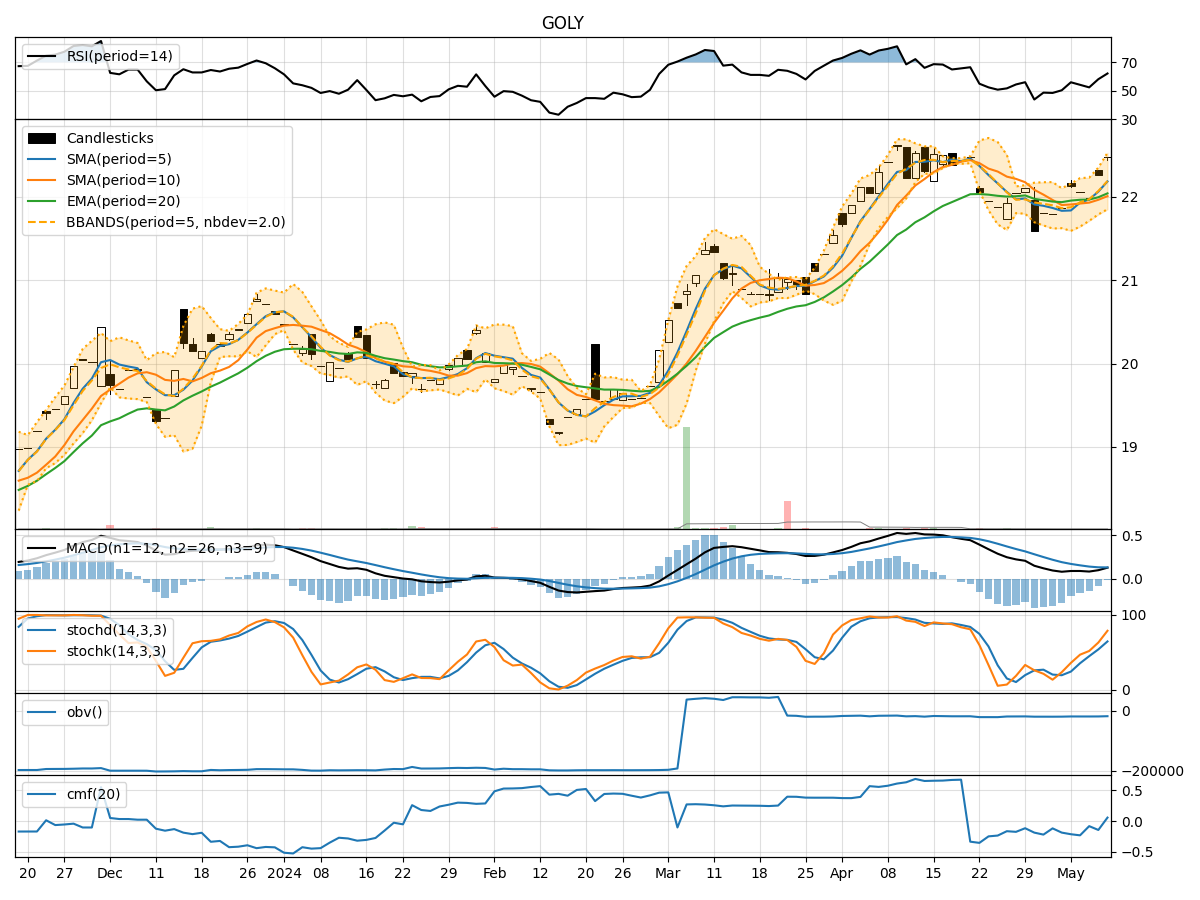
In analyzing the technical indicators for GOLY over the last 5 days, we will delve into the trend, momentum, volatility, and volume indicators to provide a comprehensive outlook on the possible stock price movement in the coming days. By examining these key aspects, we aim to offer valuable insights and predictions for potential investors.
Trend Indicators:
- Moving Averages (MA): The 5-day MA has been fluctuating around the closing prices, indicating short-term price trends. The SMA(10) and EMA(20) show a slight downward trend, suggesting a potential bearish sentiment.
- MACD: The MACD line has been decreasing, with the MACD line crossing below the signal line, indicating a bearish signal.
- MACD Histogram: The MACD histogram has been consistently negative, further supporting the bearish sentiment.
Momentum Indicators:
- RSI: The RSI has been hovering around the neutral zone, indicating a lack of strong momentum in either direction.
- Stochastic Oscillator: Both %K and %D have been declining, suggesting a weakening momentum.
- Williams %R: The indicator has been in oversold territory, indicating a potential reversal or consolidation.
Volatility Indicators:
- Bollinger Bands: The bands have been narrowing, indicating decreasing volatility and a potential period of consolidation.
- Bollinger %B: The %B indicator has been fluctuating around the midline, suggesting a lack of clear direction in price movement.
Volume Indicators:
- On-Balance Volume (OBV): The OBV has been relatively flat, indicating a balance between buying and selling pressure.
- Chaikin Money Flow (CMF): The CMF has been negative, suggesting a net outflow of money from the stock.
Key Observations and Opinions:
- Trend: The trend indicators point towards a bearish sentiment, with moving averages and MACD signaling a potential downward movement.
- Momentum: Momentum indicators show a lack of strong momentum, with stochastic oscillators indicating a weakening trend.
- Volatility: Volatility indicators suggest a period of consolidation, with Bollinger Bands narrowing.
- Volume: Volume indicators reflect a balanced market sentiment, with OBV and CMF indicating a neutral to bearish outlook.
Conclusion:
Based on the analysis of the technical indicators, the overall outlook for GOLY in the next few days is bearish. The trend indicators, momentum indicators, and volume indicators all point towards a potential downward movement in the stock price. The narrowing Bollinger Bands and lack of strong momentum further support this bearish view. Investors should exercise caution and consider potential short-term selling opportunities or wait for a clearer bullish signal before entering a long position.