Technical Analysis of GRNB 2024-05-31
Overview:
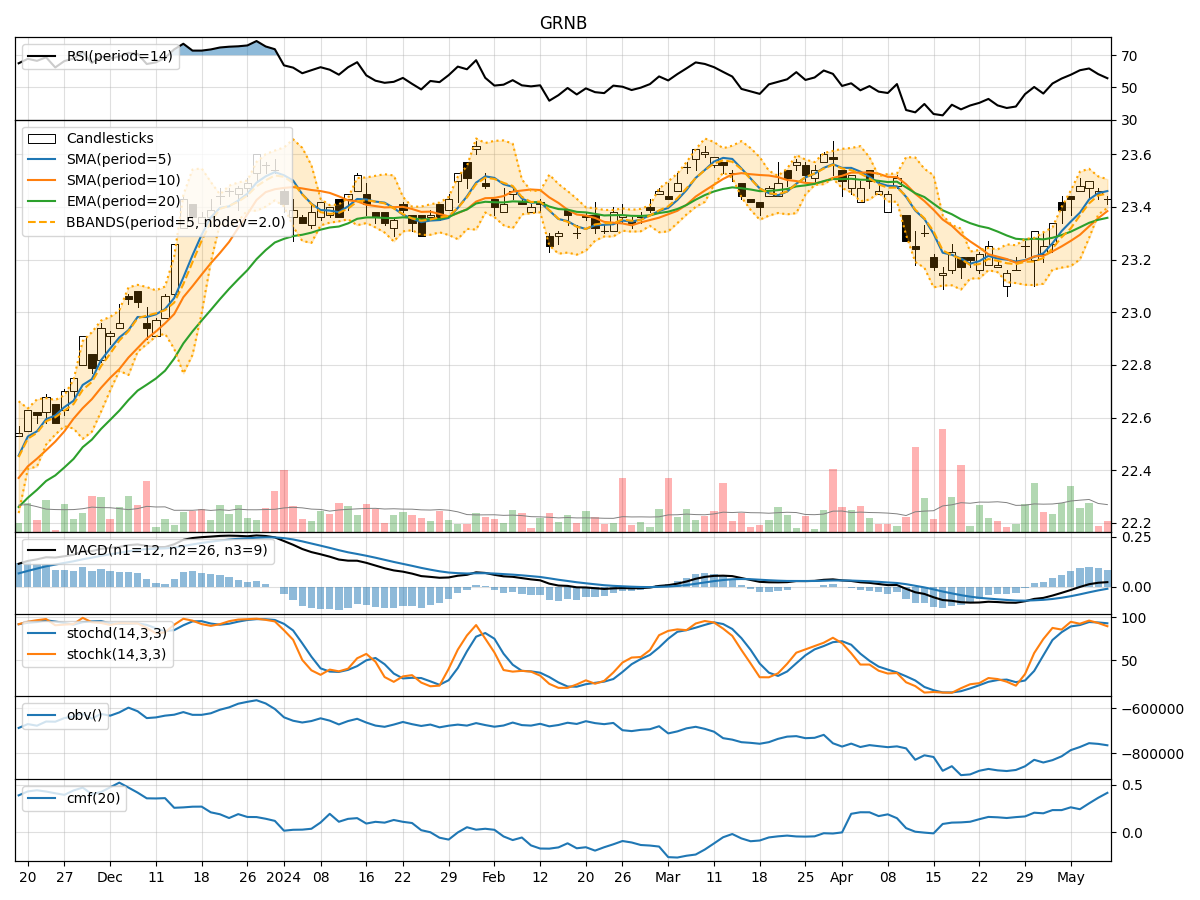
In analyzing the technical indicators for GRNB over the last 5 days, we will delve into the trend, momentum, volatility, and volume indicators to provide a comprehensive outlook on the possible stock price movement in the coming days. By examining these key aspects, we aim to offer valuable insights and predictions for potential investors.
Trend Analysis:
- Moving Averages (MA): The 5-day Moving Average (MA) has been fluctuating around the closing prices, indicating a lack of clear trend direction.
- MACD: The Moving Average Convergence Divergence (MACD) has shown slight positive values, suggesting a potential bullish momentum.
- EMA: The Exponential Moving Average (EMA) has been relatively stable, reflecting a neutral trend.
Key Observation: The trend indicators suggest a mixed outlook with a slight bullish bias.
Momentum Analysis:
- RSI: The Relative Strength Index (RSI) has been oscillating around the mid-level, indicating a balanced momentum.
- Stochastic Oscillator: Both %K and %D have shown fluctuations, but not in extreme overbought or oversold territories.
- Williams %R: The Williams %R has been hovering near oversold levels, signaling a potential buying opportunity.
Key Observation: Momentum indicators point towards a neutral to slightly bullish sentiment.
Volatility Analysis:
- Bollinger Bands (BB): The Bollinger Bands have shown narrowing bands, suggesting decreasing volatility.
Key Observation: Volatility has been decreasing, indicating a possible period of consolidation or a calm market environment.
Volume Analysis:
- On-Balance Volume (OBV): The OBV has been negative, indicating selling pressure in the stock.
- Chaikin Money Flow (CMF): The CMF has been positive but decreasing, signaling a potential weakening of buying pressure.
Key Observation: Volume indicators reflect a bearish sentiment with selling pressure dominating.
Conclusion:
Based on the analysis of the technical indicators, the next few days for GRNB could see sideways movement with a slight bullish bias. The trend indicators suggest a mixed outlook, while momentum indicators lean towards a neutral to slightly bullish sentiment. Volatility is decreasing, indicating a possible consolidation phase, and volume indicators point towards selling pressure but with a potential weakening of buying pressure.
Overall, a cautious approach is recommended with a watchful eye on key support and resistance levels.