Technical Analysis of HDAW 2024-05-31
Overview:
In analyzing the technical indicators for HDAW stock over the last 5 days, we will delve into the trend, momentum, volatility, and volume indicators to provide a comprehensive outlook on the possible stock price movement in the coming days. By examining these key aspects, we aim to offer valuable insights and predictions to guide your investment decisions.
Trend Analysis:
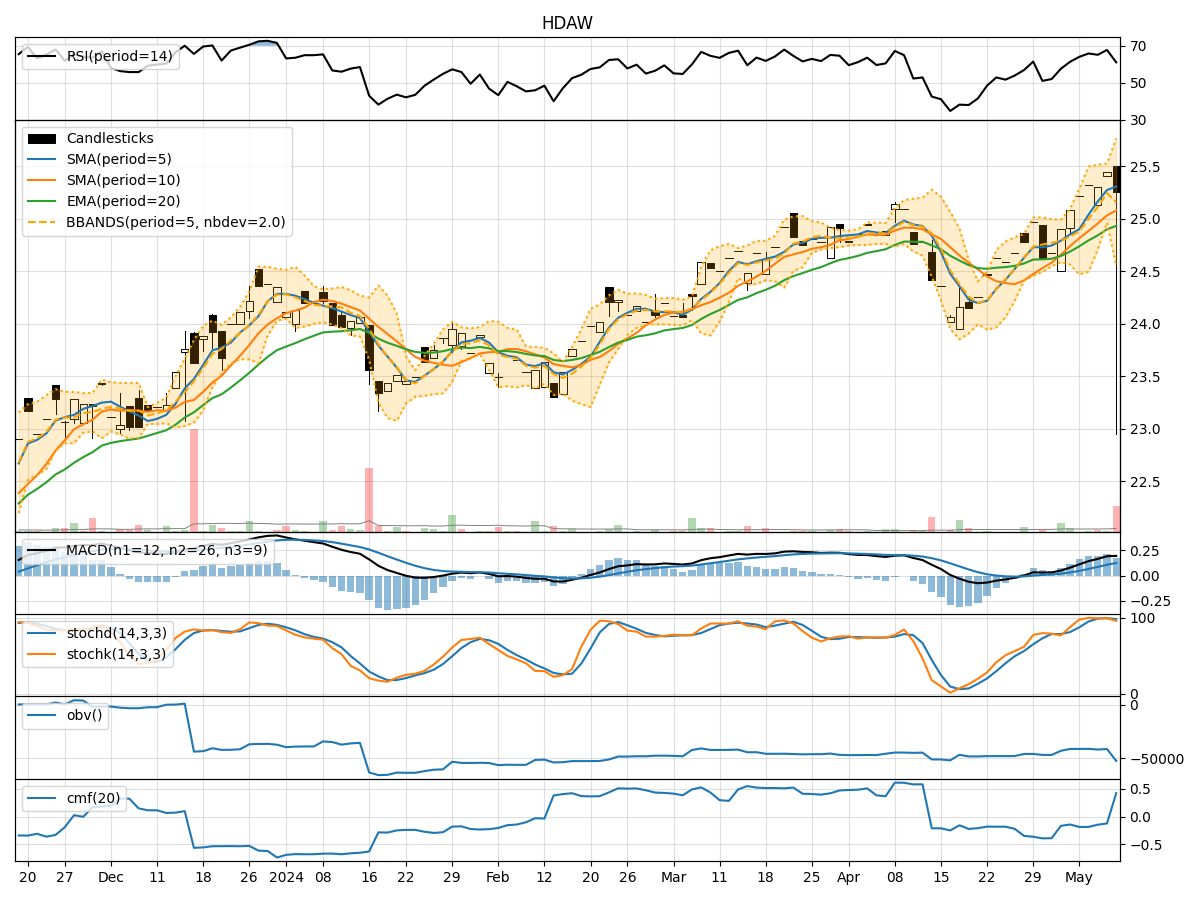
- Moving Averages (MA): The 5-day MA has been consistently below the closing price, indicating a short-term downtrend.
- MACD: The MACD line has been positive but decreasing, suggesting a potential weakening of the uptrend.
- RSI: The RSI has been fluctuating around the neutral zone, reflecting indecision in the market sentiment.
Momentum Analysis:
- Stochastic Oscillator: Both %K and %D have been declining, signaling a potential bearish momentum.
- Williams %R: The indicator has been hovering in the oversold territory, indicating a possible reversal in the short term.
Volatility Analysis:
- Bollinger Bands (BB): The stock price has been trading within the bands, showing a period of consolidation.
- BB Width: The narrowing of the bands suggests decreasing volatility and a potential breakout in the near future.
Volume Analysis:
- On-Balance Volume (OBV): The OBV has been fluctuating, indicating mixed buying and selling pressure.
- Chaikin Money Flow (CMF): The CMF has been positive but trending downwards, reflecting a decrease in buying pressure.
Conclusion:
Based on the analysis of the technical indicators, the stock is likely to experience sideways movement in the coming days. The decreasing momentum, mixed volume signals, and consolidation in volatility point towards a period of indecision in the market. Traders should exercise caution and wait for clearer signals before making significant trading decisions.