Technical Analysis of HEQT 2024-05-31
Overview:
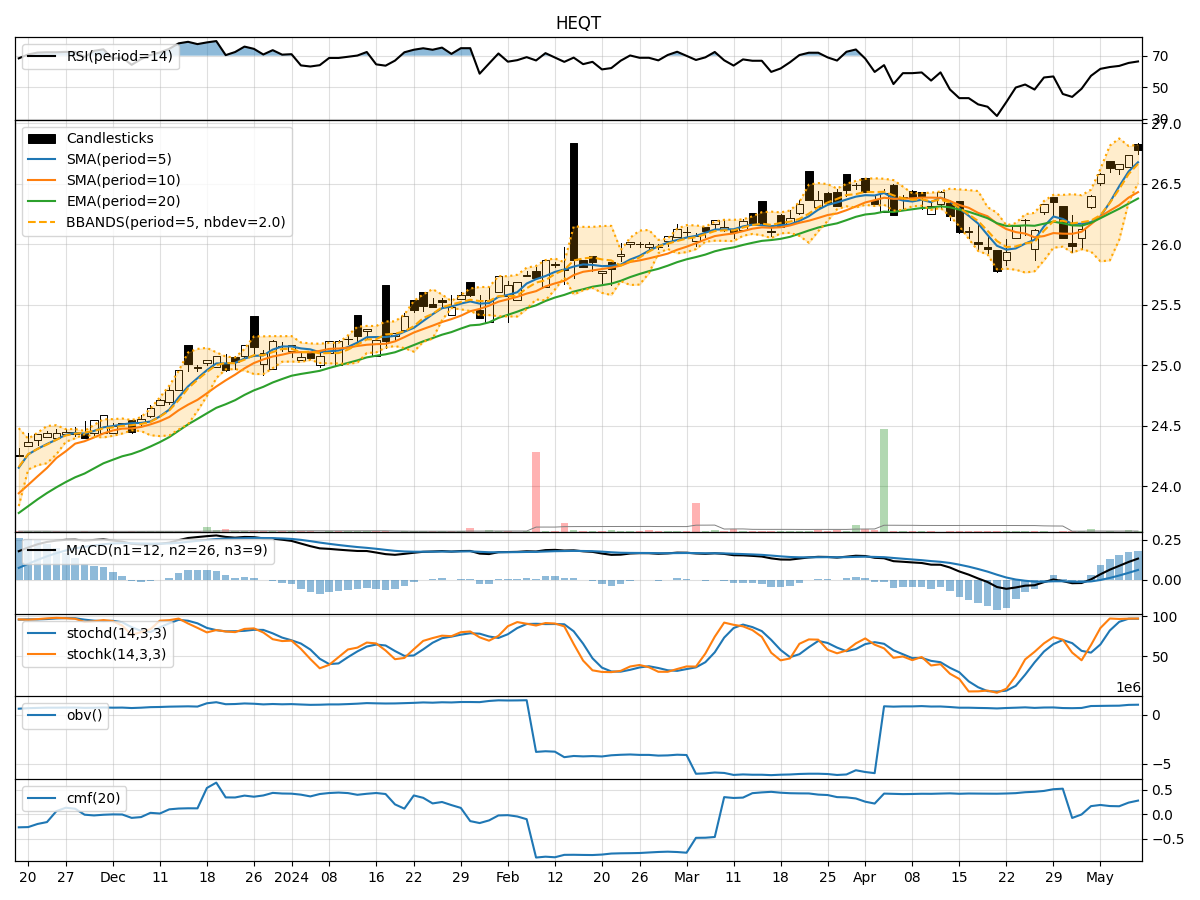
In analyzing the technical indicators for HEQT over the last 5 days, we will delve into the trend, momentum, volatility, and volume indicators to provide a comprehensive outlook on the possible stock price movement. By examining these key aspects, we aim to offer valuable insights and predictions for the upcoming days.
Trend Analysis:
- Moving Averages (MA): The 5-day MA has been relatively stable around the current price, indicating a neutral trend.
- MACD: The MACD line has shown slight fluctuations but remains close to the signal line, suggesting a lack of strong momentum in either direction.
- EMA: The EMA has been gradually increasing, reflecting a positive trend in the short to medium term.
Momentum Analysis:
- RSI: The RSI has fluctuated within the neutral range, indicating a balanced momentum between buying and selling pressure.
- Stochastic Oscillator: Both %K and %D have been declining, signaling a potential bearish momentum.
- Williams %R: The indicator has been hovering in the oversold territory, suggesting a possible reversal in the short term.
Volatility Analysis:
- Bollinger Bands (BB): The bands have widened, indicating increased volatility in the stock price.
- BB %B: The %B has fluctuated but is currently around the middle range, suggesting a balanced volatility level.
Volume Analysis:
- On-Balance Volume (OBV): The OBV has shown a slight decrease, indicating some distribution of shares.
- Chaikin Money Flow (CMF): The CMF has been positive, reflecting buying pressure in the market.
Key Observations:
- The trend indicators suggest a neutral to slightly positive outlook.
- Momentum indicators show a mixed signal with a potential bearish bias.
- Volatility has increased, indicating potential price swings.
- Volume indicators point towards a balanced market sentiment with a slight inclination towards buying pressure.
Conclusion:
Based on the analysis of the technical indicators, the next few days for HEQT stock price movement could be sideways with a slight bearish bias. Traders should exercise caution and closely monitor key support and resistance levels for potential entry or exit points. It is advisable to wait for more clarity in the market direction before making significant trading decisions.