Technical Analysis of HJAN 2024-05-31
Overview:
In analyzing the technical indicators for HJAN stock over the last 5 days, we will delve into the trend, momentum, volatility, and volume indicators to provide a comprehensive outlook on the possible future stock price movement. By examining these key indicators, we aim to offer valuable insights and recommendations for potential investors.
Trend Indicators:
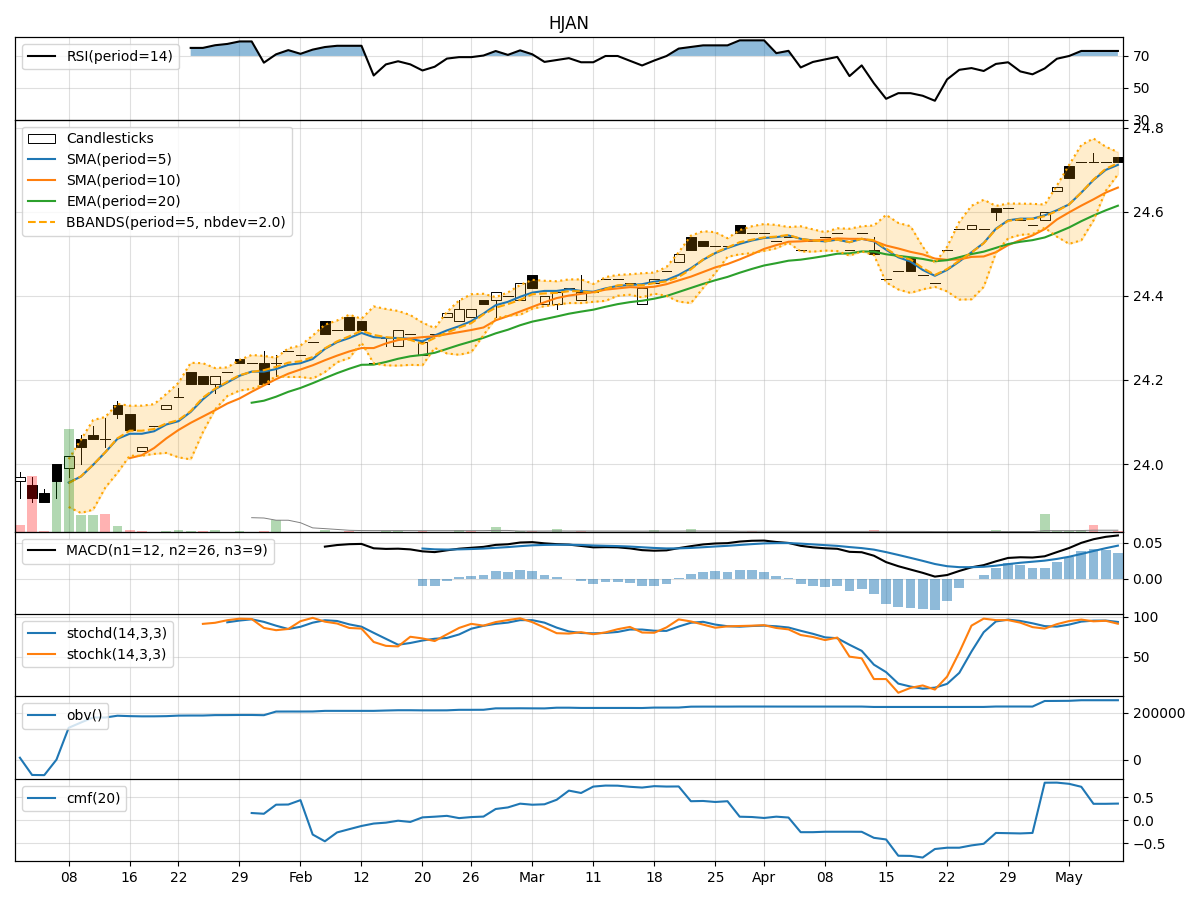
- Moving Averages (MA): The 5-day MA has been relatively stable around the closing price, indicating a neutral trend.
- MACD: The MACD line has shown a slight positive trend, with the MACD histogram fluctuating around the zero line.
- EMA: The EMA has been gradually increasing, suggesting a bullish sentiment in the short term.
Momentum Indicators:
- RSI: The RSI has been fluctuating within the neutral range, indicating a lack of strong momentum.
- Stochastic Oscillator: Both %K and %D have been in the overbought territory, suggesting a potential reversal or consolidation.
- Williams %R: The Williams %R has been hovering around the oversold region, indicating a possible buying opportunity.
Volatility Indicators:
- Bollinger Bands (BB): The stock price has been trading within the Bollinger Bands, indicating normal volatility.
- BB %B: The %B indicator has been fluctuating around the midline, suggesting a balanced market sentiment.
Volume Indicators:
- On-Balance Volume (OBV): The OBV has been relatively flat, indicating a lack of significant buying or selling pressure.
- Chaikin Money Flow (CMF): The CMF has been positive but declining, signaling a potential decrease in buying pressure.
Key Observations:
- The trend indicators show a slightly bullish sentiment in the short term.
- Momentum indicators suggest a lack of strong buying or selling pressure.
- Volatility remains within normal levels, indicating stability.
- Volume indicators point to a neutral stance with no clear accumulation or distribution signals.
Conclusion:
Based on the analysis of the technical indicators, the next few days for HJAN stock are likely to see sideways movement with a slight bullish bias. Investors should monitor key levels such as the moving averages and MACD for potential trend reversals. Additionally, keeping an eye on the Stochastic Oscillator and Williams %R for any overbought or oversold conditions can provide valuable insights for trading decisions. Overall, a cautious approach with a focus on risk management is recommended in the current market environment.