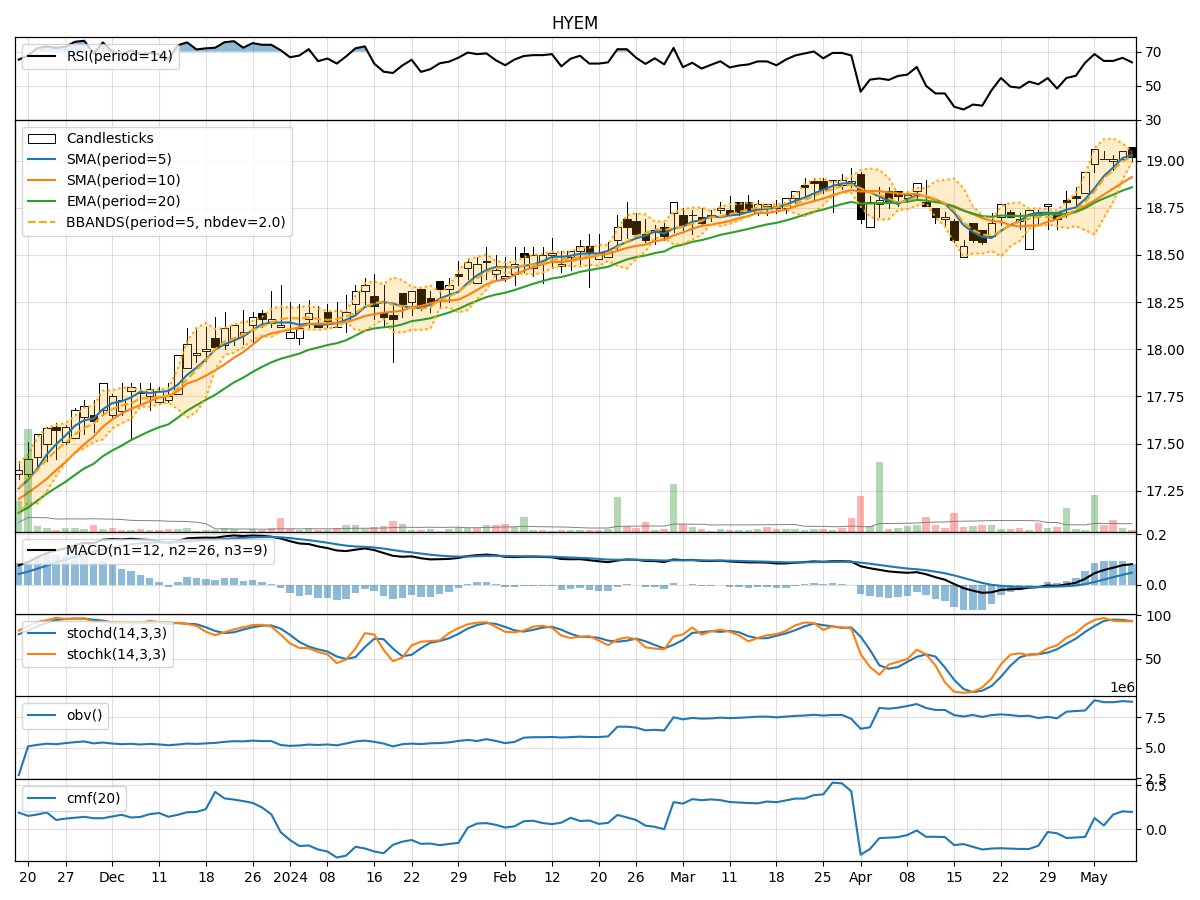
Technical Analysis of HYEM 2024-05-31
Overview:
In analyzing the technical indicators for HYEM over the last 5 days, we will delve into the trend, momentum, volatility, and volume indicators to provide a comprehensive outlook on the possible stock price movement in the coming days.
Trend Indicators:
- Moving Averages (MA): The 5-day MA has been relatively stable around the current price, indicating a short-term equilibrium.
- MACD: The MACD line has shown a slight positive trend, suggesting a potential bullish momentum.
- RSI: The RSI has been fluctuating but remains in the neutral zone, indicating a balanced market sentiment.
Momentum Indicators:
- Stochastic Oscillator: Both %K and %D have been fluctuating, reflecting indecision in the market.
- Williams %R: The indicator has been moving towards oversold levels, signaling a potential buying opportunity.
Volatility Indicators:
- Bollinger Bands: The bands have been narrowing, indicating decreasing volatility and a possible consolidation phase.
- BB%: The %B indicator has been hovering around the midline, suggesting a balanced market sentiment.
Volume Indicators:
- On-Balance Volume (OBV): The OBV has shown a slight increase, indicating some accumulation by investors.
- Chaikin Money Flow (CMF): The CMF has been positive, suggesting buying pressure in the market.
Key Observations:
- The trend indicators show a neutral to slightly bullish bias.
- Momentum indicators reflect indecision in the market with a potential buying opportunity.
- Volatility indicators point towards a consolidation phase with decreasing volatility.
- Volume indicators indicate some accumulation and buying pressure in the market.
Conclusion:
Based on the analysis of the technical indicators, the next few days for HYEM are likely to see sideways movement with a slight bullish bias. Traders may consider monitoring key support and resistance levels for potential entry and exit points. It is advisable to exercise caution and wait for clearer signals before making significant trading decisions.