Technical Analysis of HYXU 2024-05-31
Overview:
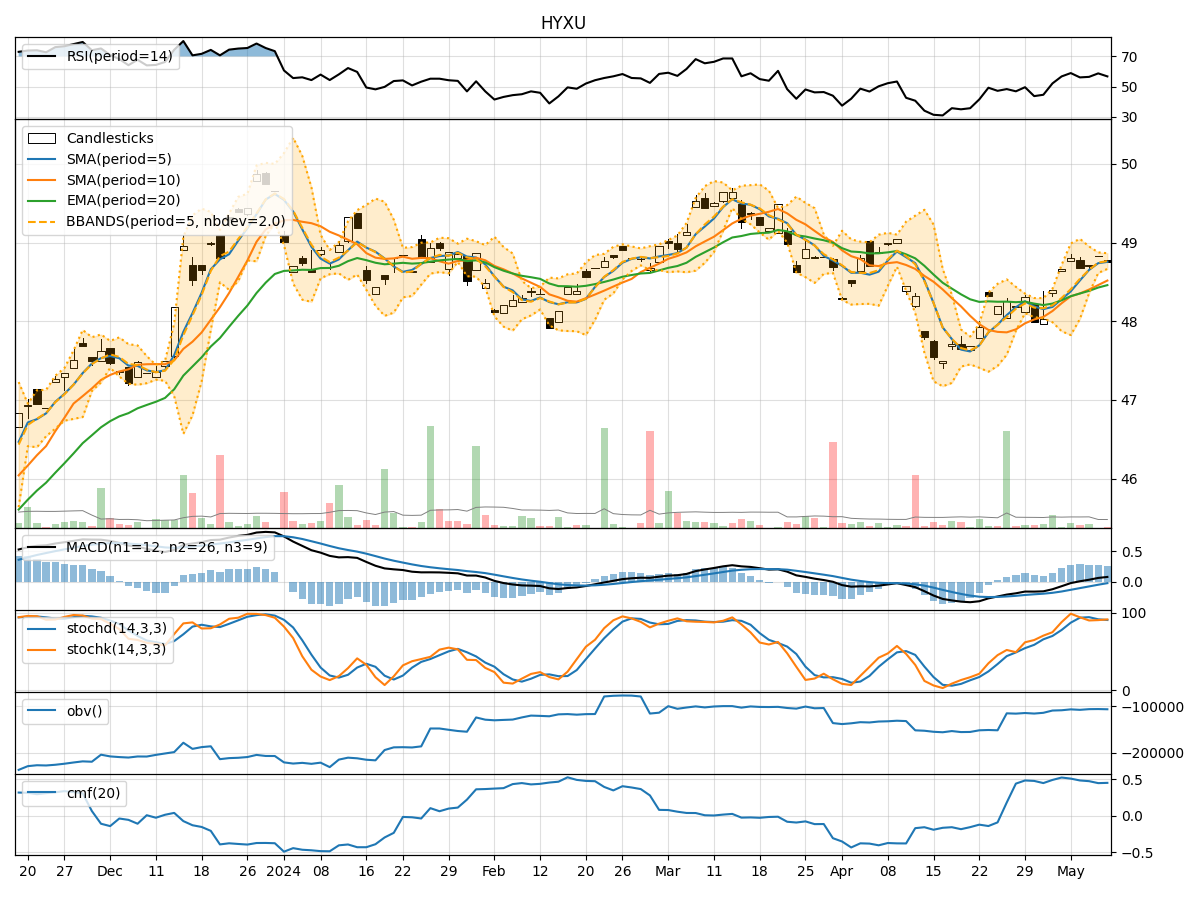
In the last 5 trading days, HYXU stock has shown mixed signals across various technical indicators. The trend indicators suggest a relatively stable price movement, with the Moving Average Convergence Divergence (MACD) showing a slight positive momentum. However, the Momentum Indicators indicate a more neutral stance, with the Relative Strength Index (RSI) hovering around the mid-level. Volatility indicators show a narrowing of the Bollinger Bands, indicating a potential decrease in price volatility. Volume indicators suggest a decrease in On-Balance Volume (OBV) and Chaikin Money Flow (CMF), signaling a possible weakening of buying pressure.
Trend Indicators:
- Moving Averages (MA) show a consistent price level around the 5-day MA.
- MACD indicates a slight positive momentum, with the MACD line above the signal line.
- Overall, the trend indicators suggest a sideways movement with a slight bullish bias.
Momentum Indicators:
- RSI is fluctuating around the neutral level, indicating a lack of strong buying or selling pressure.
- Stochastic Oscillator shows mixed signals, with no clear trend direction.
- Williams %R is also fluctuating, suggesting indecision in the market.
- The momentum indicators point towards a neutral stance with no clear trend direction.
Volatility Indicators:
- Bollinger Bands are narrowing, indicating decreasing price volatility.
- The narrowing of the bands suggests a potential consolidation phase or a calm period in terms of price movement.
Volume Indicators:
- On-Balance Volume (OBV) is decreasing, indicating a potential decrease in buying pressure.
- Chaikin Money Flow (CMF) is also declining, signaling weakening buying interest.
- The volume indicators suggest a weakening of bullish momentum.
Conclusion:
Based on the analysis of the technical indicators, the next few days for HYXU stock are likely to see a sideways movement with a neutral bias. The narrowing Bollinger Bands and decreasing volume indicators suggest a period of consolidation or calm price action. Traders and investors may expect the stock price to remain relatively stable with no significant directional bias in the short term. It is advisable to closely monitor key support and resistance levels for potential breakout opportunities in the future.