Technical Analysis of IBHJ 2024-05-31
Overview:
In analyzing the technical indicators for IBHJ stock over the last 5 days, we will delve into the trends, momentum, volatility, and volume aspects to provide a comprehensive outlook on the possible stock price movement in the coming days. By examining key indicators such as moving averages, MACD, RSI, Bollinger Bands, and OBV, we aim to offer valuable insights and predictions for informed decision-making.
Trend Analysis:
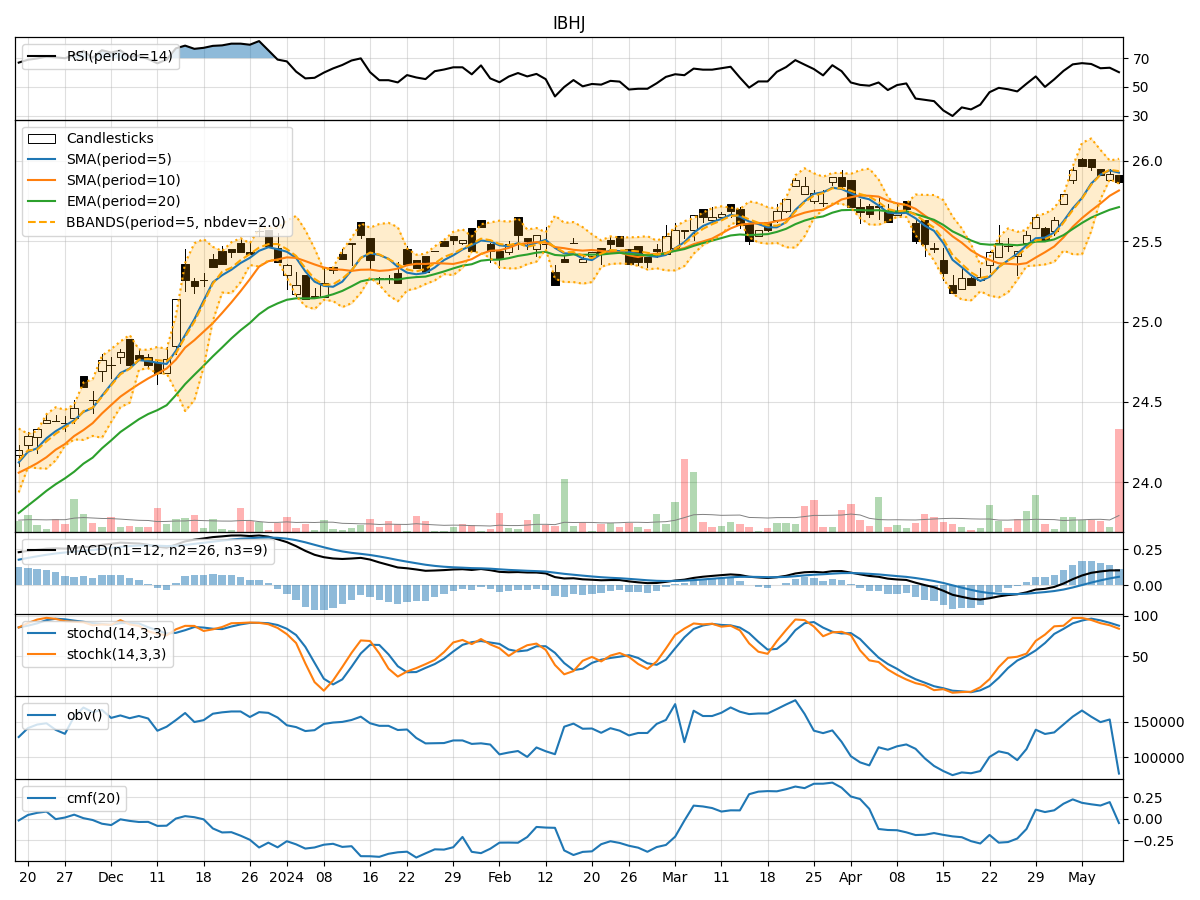
- Moving Averages (MA): The 5-day MA has been fluctuating around the closing prices, indicating a relatively stable trend.
- MACD: The MACD line has been positive, suggesting a bullish momentum in the short term.
- EMA: The EMA has been slightly increasing, reflecting a positive trend.
Key Observation: The trend indicators show a mildly bullish sentiment in the short term.
Momentum Analysis:
- RSI: The RSI has been oscillating around the 50 level, indicating a neutral momentum.
- Stochastic Oscillator: Both %K and %D have been fluctuating, showing indecision in momentum.
- Williams %R: The indicator has been hovering in the oversold territory, signaling a potential reversal.
Key Observation: Momentum indicators suggest a lack of clear direction, with a slight bias towards a potential reversal.
Volatility Analysis:
- Bollinger Bands: The stock price has been trading within the bands, suggesting a period of consolidation.
- Bollinger %B: The %B indicator has been fluctuating around the midline, indicating a balanced volatility.
Key Observation: Volatility indicators point towards a period of consolidation and stability.
Volume Analysis:
- On-Balance Volume (OBV): The OBV has been declining, indicating selling pressure in the stock.
- Chaikin Money Flow (CMF): The CMF has been negative, reflecting a lack of buying interest.
Key Observation: Volume indicators highlight a bearish sentiment with selling pressure prevailing in the stock.
Conclusion:
Based on the analysis of trend, momentum, volatility, and volume indicators, the stock is likely to experience a period of consolidation with a slightly bullish bias in the short term. The lack of clear momentum direction, coupled with stable volatility and bearish volume signals, suggests that the stock may trade within a narrow range in the coming days. Traders should exercise caution and wait for a clearer trend to emerge before making significant trading decisions.
Key Takeaways:
- Trend: Mildly bullish in the short term.
- Momentum: Neutral with a potential for reversal.
- Volatility: Consolidation phase.
- Volume: Bearish sentiment with selling pressure.
In summary, while the stock may exhibit some upward movement, it is essential to monitor key levels and wait for confirmation signals before taking any significant positions.