Technical Analysis of IDHQ 2024-05-31
Overview:
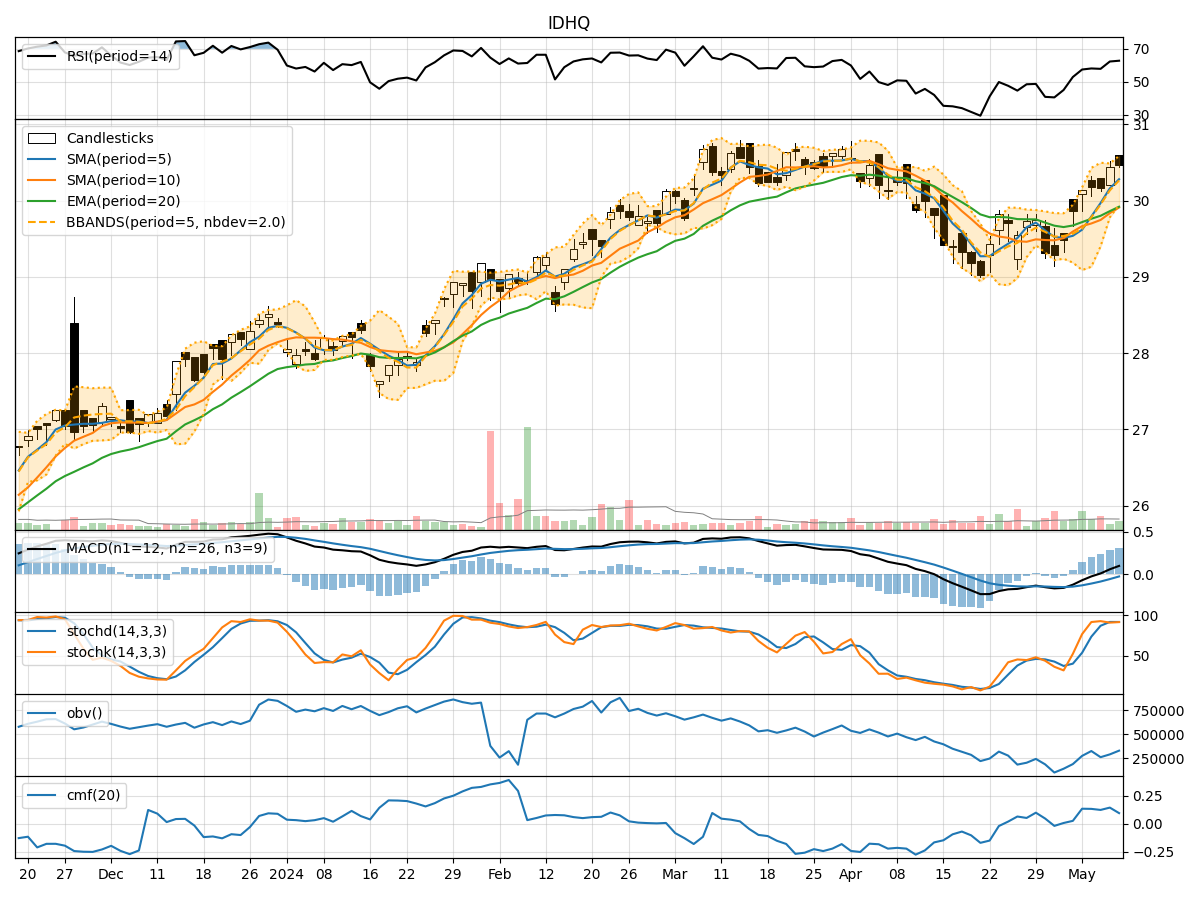
In analyzing the technical indicators for IDHQ over the last 5 days, we will delve into the trend, momentum, volatility, and volume indicators to provide a comprehensive outlook on the possible stock price movement in the coming days. By examining these key aspects, we aim to offer valuable insights and predictions to guide your investment decisions.
Trend Analysis:
- Moving Averages (MA): The 5-day MA has been fluctuating around the closing prices, indicating short-term price trends. The SMA(10) and EMA(20) have shown slight variations but have generally followed the price movements.
- MACD: The MACD line has been positive, indicating a bullish trend, although the MACD histogram has shown a slight decrease in momentum over the last few days.
Momentum Analysis:
- RSI: The RSI has been hovering around the neutral zone, suggesting a balanced momentum between buying and selling pressure.
- Stochastic Oscillator: Both %K and %D have been declining, indicating a potential bearish momentum in the short term.
- Williams %R: The Williams %R has been in the oversold territory, signaling a possible reversal in the stock price.
Volatility Analysis:
- Bollinger Bands (BB): The stock price has been trading within the bands, with the upper and lower bands providing potential resistance and support levels.
- Bollinger %B: The %B indicator has been fluctuating, indicating periods of volatility and potential price reversals.
Volume Analysis:
- On-Balance Volume (OBV): The OBV has shown a slight decrease, suggesting a divergence between price and volume movements.
- Chaikin Money Flow (CMF): The CMF has been negative, indicating selling pressure in the market.
Key Observations:
- The trend indicators suggest a mixed outlook, with the MACD showing bullish signals but the moving averages lacking a clear direction.
- Momentum indicators point towards a potential bearish bias in the short term, as indicated by the declining stochastic oscillator and oversold Williams %R.
- Volatility indicators highlight potential price fluctuations within the Bollinger Bands, with %B indicating periods of increased volatility.
- Volume indicators reflect a divergence between price and volume movements, with selling pressure evident in the CMF and OBV.
Conclusion:
Based on the analysis of the technical indicators, the short-term outlook for IDHQ appears to be bearish. The momentum indicators suggest a potential downside movement, supported by the oversold condition of the Williams %R and the negative CMF. Additionally, the lack of clear direction in the trend indicators and the presence of volatility within the Bollinger Bands further support a cautious approach towards the stock.
Recommendation: Considering the bearish signals from the technical indicators, it is advisable to exercise caution and closely monitor the price movements before making any trading decisions. Traders may consider implementing risk management strategies to mitigate potential losses in the current market environment.