Technical Analysis of IEFA 2024-05-31
Overview:
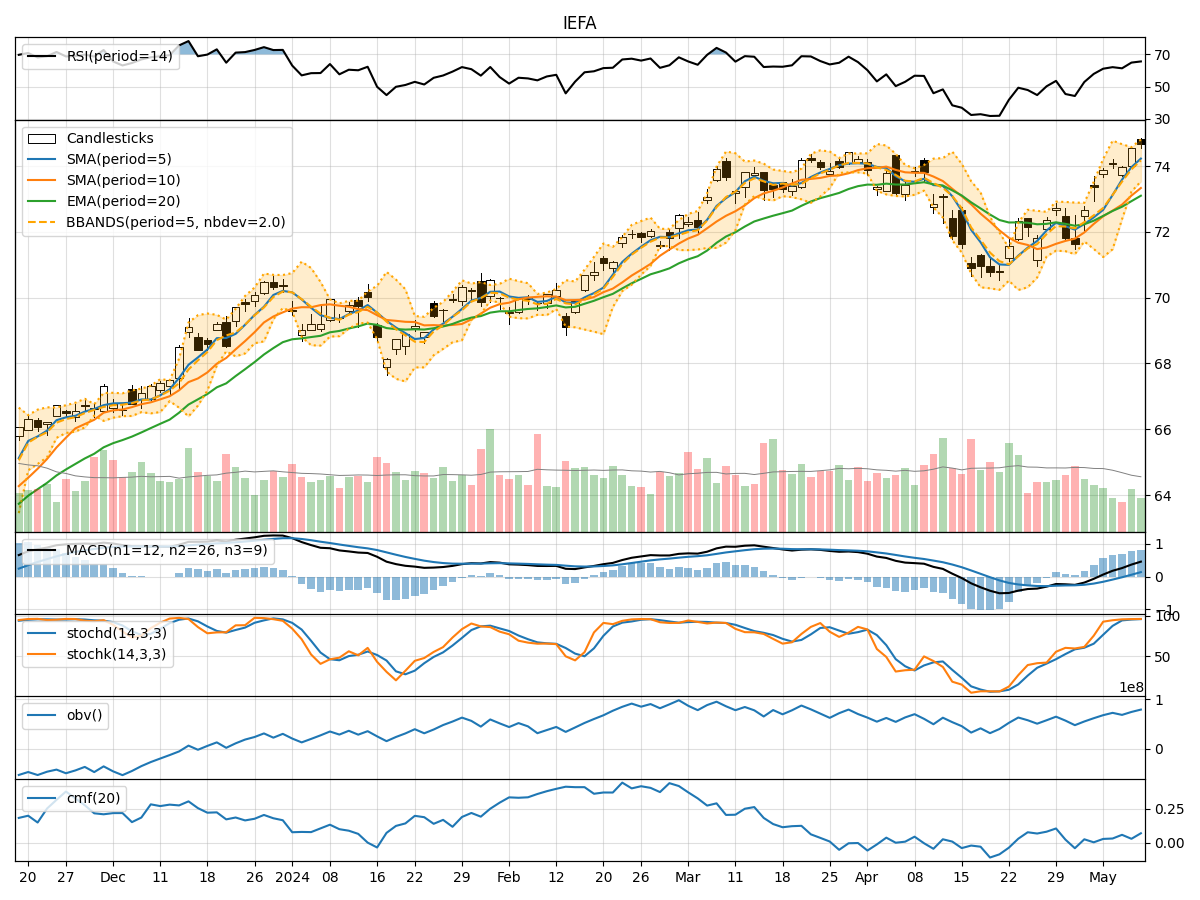
In analyzing the technical indicators for IEFA over the last 5 days, we will delve into the trend, momentum, volatility, and volume indicators to provide a comprehensive outlook on the possible stock price movement in the coming days. By examining these key indicators, we aim to offer valuable insights and predictions for potential investors.
Trend Indicators:
- Moving Averages (MA): The 5-day MA has been fluctuating around the closing prices, indicating a lack of clear trend direction.
- MACD: The MACD line has been positive but showing signs of convergence towards the signal line, suggesting a potential shift in momentum.
- EMA: The EMA has been relatively stable, reflecting a moderate bullish sentiment.
Key Observation: The trend indicators suggest a neutral to slightly bullish outlook for IEFA.
Momentum Indicators:
- RSI: The RSI has been hovering around the mid-level, indicating a balanced momentum between buying and selling pressure.
- Stochastic Oscillator: Both %K and %D have been declining, signaling a potential bearish momentum.
- Williams %R: The indicator has been fluctuating in the oversold territory, hinting at a possible reversal.
Key Observation: Momentum indicators are mixed, with a slight inclination towards a bearish bias.
Volatility Indicators:
- Bollinger Bands: The bands have been narrowing, indicating decreasing volatility and a potential price breakout.
- Bollinger %B: The %B has been fluctuating around the midline, suggesting a balanced volatility.
Key Observation: Volatility indicators point towards a potential breakout in price direction.
Volume Indicators:
- On-Balance Volume (OBV): The OBV has shown mixed signals, with fluctuations in volume accumulation.
- Chaikin Money Flow (CMF): The CMF has been positive, indicating buying pressure in the market.
Key Observation: Volume indicators reflect a neutral stance with no clear trend in volume accumulation.
Conclusion:
Based on the analysis of the technical indicators, the next few days for IEFA could see sideways consolidation with a slight bearish bias. The trend indicators suggest a neutral to slightly bullish outlook, while momentum indicators lean towards a bearish bias. Volatility indicators hint at a potential breakout, and volume indicators show mixed signals.
Overall, the stock is likely to experience sideways movement with a potential downside bias in the near term. Investors should closely monitor key support and resistance levels for potential entry or exit points.