Technical Analysis of IGIB 2024-05-31
Overview:
In analyzing the technical indicators for IGIB stock over the last 5 days, we will delve into the trend, momentum, volatility, and volume indicators to provide a comprehensive outlook on the possible stock price movement in the coming days. By examining these key indicators, we aim to offer valuable insights and predictions for informed decision-making.
Trend Analysis:
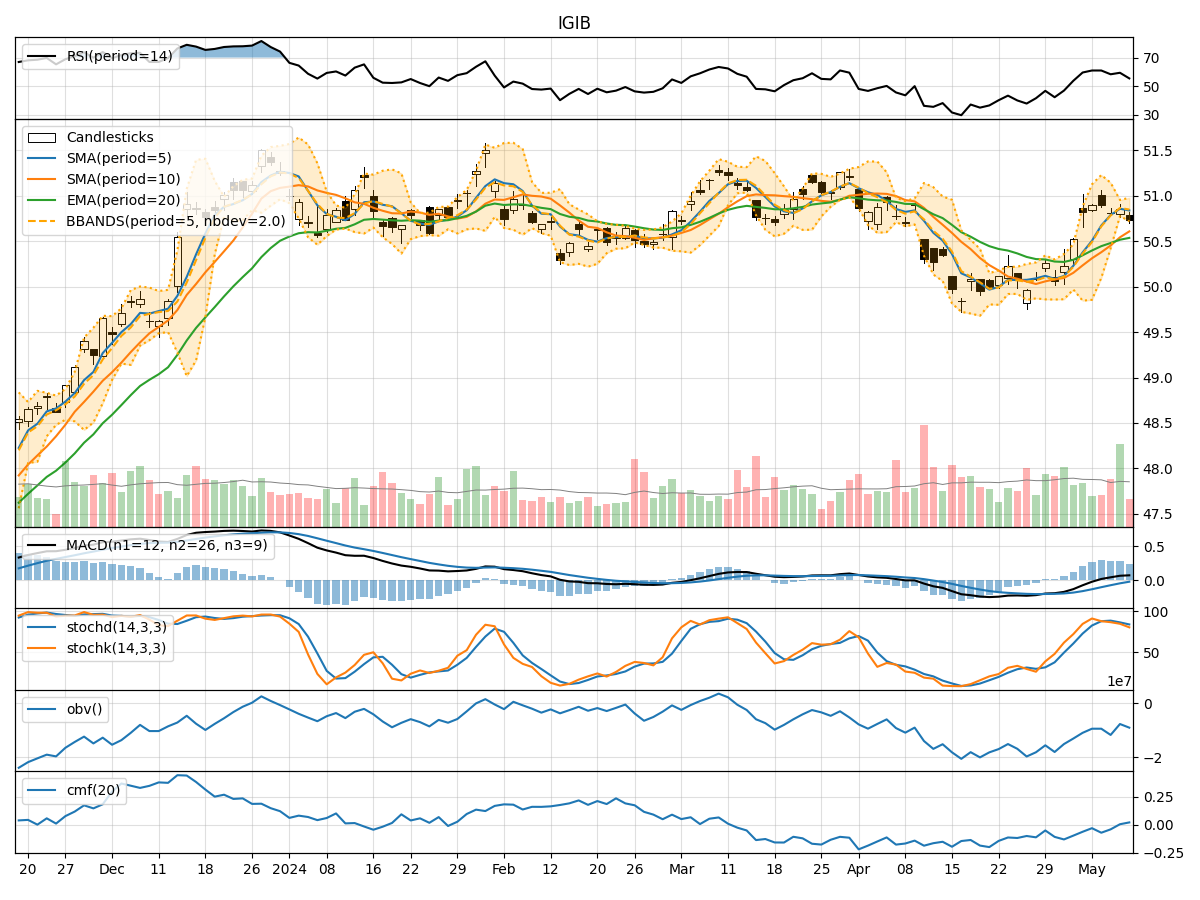
- Moving Averages (MA): The 5-day Moving Average (MA) has been fluctuating around the closing prices, indicating a relatively stable trend.
- MACD: The Moving Average Convergence Divergence (MACD) has shown a slight positive trend, with the MACD line consistently above the signal line.
- EMA: The Exponential Moving Average (EMA) has been relatively flat, suggesting a lack of strong directional bias.
Momentum Analysis:
- RSI: The Relative Strength Index (RSI) has been oscillating around the mid-level, indicating a neutral momentum.
- Stochastic Oscillator: Both %K and %D of the Stochastic Oscillator have been fluctuating, reflecting indecision in momentum.
- Williams %R: The Williams %R has shown oversold and overbought conditions, signaling potential reversals.
Volatility Analysis:
- Bollinger Bands (BB): The Bollinger Bands have been narrowing, suggesting decreasing volatility.
- BB%: The %B indicator has been hovering around the middle band, indicating a balanced volatility level.
Volume Analysis:
- On-Balance Volume (OBV): The OBV has been declining, indicating selling pressure in the stock.
- Chaikin Money Flow (CMF): The CMF has been negative, suggesting outflow of money from the stock.
Key Observations:
- The stock is currently in a sideways consolidation phase, with no clear trend direction.
- Momentum indicators show mixed signals with no strong bullish or bearish bias.
- Volatility has been decreasing, indicating a potential breakout or breakdown.
- Volume indicators suggest bearish sentiment with selling pressure.
Conclusion:
Based on the analysis of technical indicators, the next few days for IGIB stock are likely to see sideways movement with a slight bearish bias. Traders should exercise caution and wait for a clearer trend to emerge before making significant trading decisions. It is advisable to closely monitor key support and resistance levels for potential breakout or breakdown scenarios.