Technical Analysis of IGLB 2024-05-31
Overview:
In analyzing the technical indicators for IGLB over the last 5 days, we will delve into the trends, momentum, volatility, and volume indicators to provide a comprehensive outlook on the possible stock price movement in the coming days. By examining these key aspects, we aim to offer valuable insights and predictions for informed decision-making.
Trend Indicators:
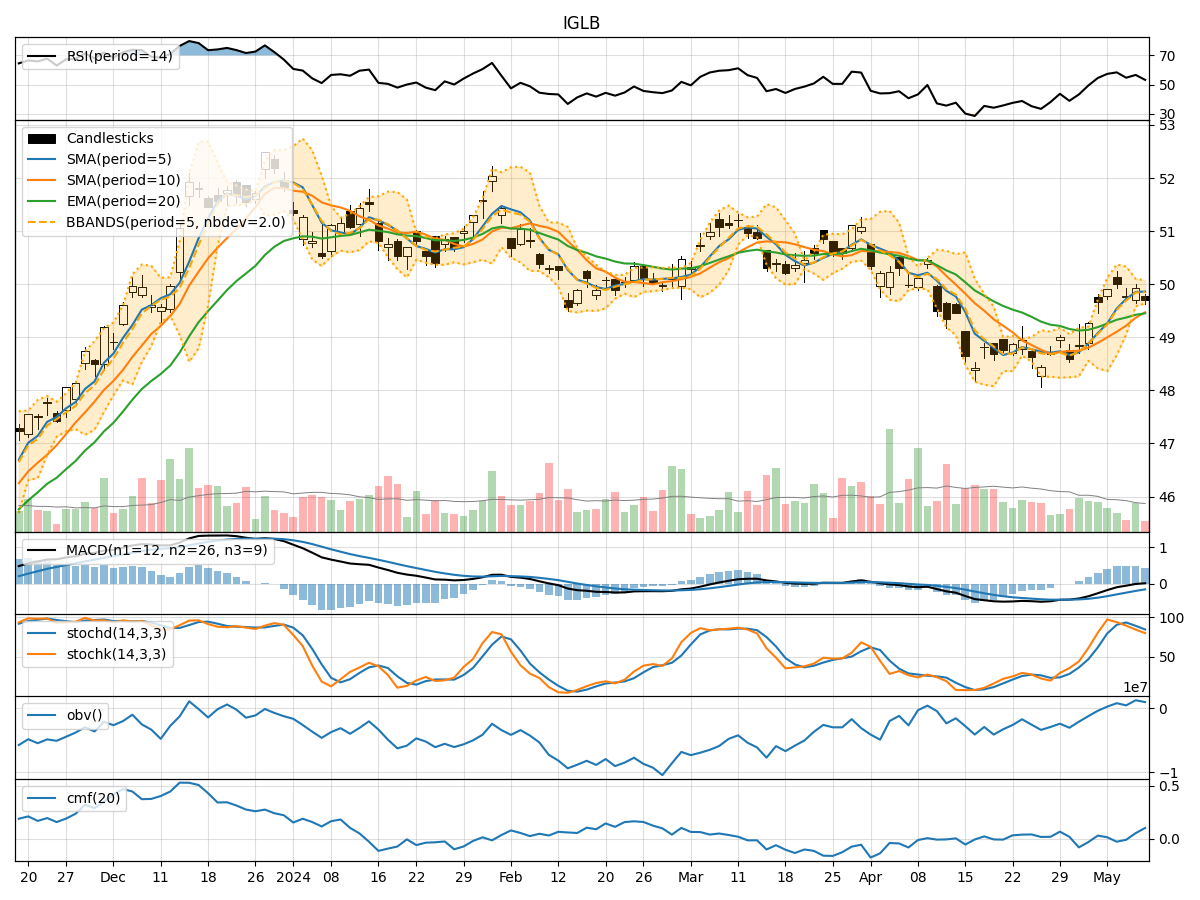
- Moving Averages (MA): The 5-day MA has been fluctuating around the closing prices, indicating a lack of clear trend direction.
- MACD: The MACD line has been hovering around the signal line, suggesting a neutral momentum.
- EMA: The EMA has been relatively stable, showing a slight upward bias.
Key Observation: The trend indicators suggest a lack of strong directional movement, with a neutral to slightly bullish bias.
Momentum Indicators:
- RSI: The RSI values have been fluctuating within the neutral zone, indicating indecision in the market.
- Stochastic Oscillator: Both %K and %D have been oscillating, failing to provide a clear signal.
- Williams %R: The indicator has been in oversold territory, reflecting potential buying opportunities.
Key Observation: Momentum indicators signal a lack of strong momentum, with a neutral to slightly bearish bias.
Volatility Indicators:
- Bollinger Bands (BB): The bands have been narrowing, suggesting decreasing volatility.
- BB %B: The %B indicator has been fluctuating within a narrow range, indicating consolidation.
Key Observation: Volatility indicators point towards decreasing volatility and a potential period of consolidation.
Volume Indicators:
- On-Balance Volume (OBV): The OBV has shown mixed movements, failing to confirm a clear trend.
- Chaikin Money Flow (CMF): The CMF has been positive but relatively flat, indicating moderate buying pressure.
Key Observation: Volume indicators suggest mixed trading activity with a slight bullish bias.
Conclusion:
Based on the analysis of the technical indicators, the next few days for IGLB are likely to see sideways movement with a neutral to slightly bullish bias. The lack of strong trends in the trend and momentum indicators, coupled with decreasing volatility and mixed volume signals, indicates a period of consolidation. Traders may expect the stock price to trade within a range with potential buying opportunities as indicated by oversold conditions in some momentum indicators. It is advisable to closely monitor key support and resistance levels for potential breakout or reversal signals.
Key Takeaway:
- Market Outlook: Sideways with a neutral to slightly bullish bias.
- Trading Strategy: Consider range-bound trading strategies and watch for potential breakout opportunities.
- Risk Management: Set clear stop-loss levels and be cautious of false signals during consolidation phases.
By carefully considering these technical indicators and their implications, investors can make more informed decisions in navigating the upcoming price movements of IGLB.