Technical Analysis of ILTB 2024-05-31
Overview:
In analyzing the technical indicators for ILTB over the last 5 days, we will delve into the trend, momentum, volatility, and volume indicators to provide a comprehensive outlook on the possible stock price movement in the coming days. By examining these key aspects, we aim to offer valuable insights and predictions for potential investors.
Trend Indicators:
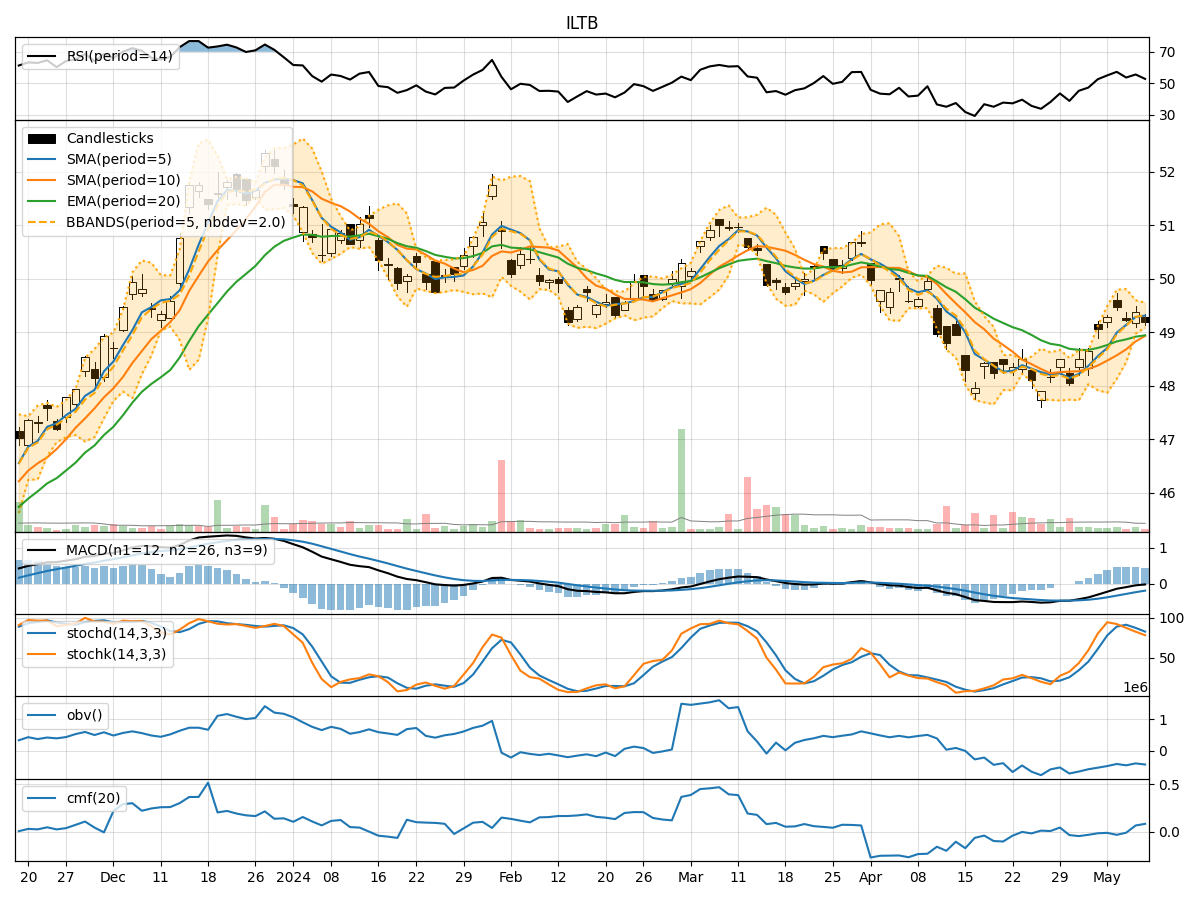
- Moving Averages (MA): The 5-day MA has been fluctuating around the closing prices, indicating a short-term trend. The SMA(10) and EMA(20) show a slight downward trend, suggesting a weakening momentum.
- MACD: The MACD line has been positive but decreasing, while the MACD Histogram has been moving towards the zero line, signaling a potential reversal.
- Conclusion: The trend indicators suggest a weakening bullish momentum in the short term.
Momentum Indicators:
- RSI: The RSI has been fluctuating around the mid-level, indicating a lack of strong momentum in either direction.
- Stochastic Oscillator: Both %K and %D have been in the oversold region, suggesting a potential reversal.
- Williams %R: The indicator has been in the oversold territory, indicating a possible buying opportunity.
- Conclusion: Momentum indicators point towards a potential reversal to the upside.
Volatility Indicators:
- Bollinger Bands: The price has been trading within the bands, with the bands narrowing, indicating decreasing volatility.
- Conclusion: Volatility is decreasing, suggesting a potential period of consolidation or a breakout in the near future.
Volume Indicators:
- On-Balance Volume (OBV): The OBV has been declining, indicating selling pressure in the stock.
- Chaikin Money Flow (CMF): The CMF has been negative, suggesting a lack of buying interest.
- Conclusion: Volume indicators reflect bearish sentiment in the stock.
Overall Conclusion:
Based on the analysis of trend, momentum, volatility, and volume indicators, the stock price of ILTB is likely to experience further consolidation in the coming days. The weakening trend, mixed momentum signals, decreasing volatility, and bearish volume indications suggest a period of uncertainty and potential range-bound trading. Investors should exercise caution and wait for clearer signals before making any significant trading decisions.
Key Recommendations:
- Monitor Price Action: Watch for a breakout above the recent highs or a breakdown below key support levels for confirmation of the next trend direction.
- Consider Risk Management: Implement stop-loss orders to protect capital in case of unexpected price movements.
- Stay Informed: Keep track of any significant news or events that could impact the stock price.
In conclusion, while the technical indicators provide valuable insights, it is essential to combine them with fundamental analysis and market dynamics for a holistic view. Stay vigilant and adapt your strategy based on evolving market conditions.