Technical Analysis of IRET 2024-05-31
Overview:
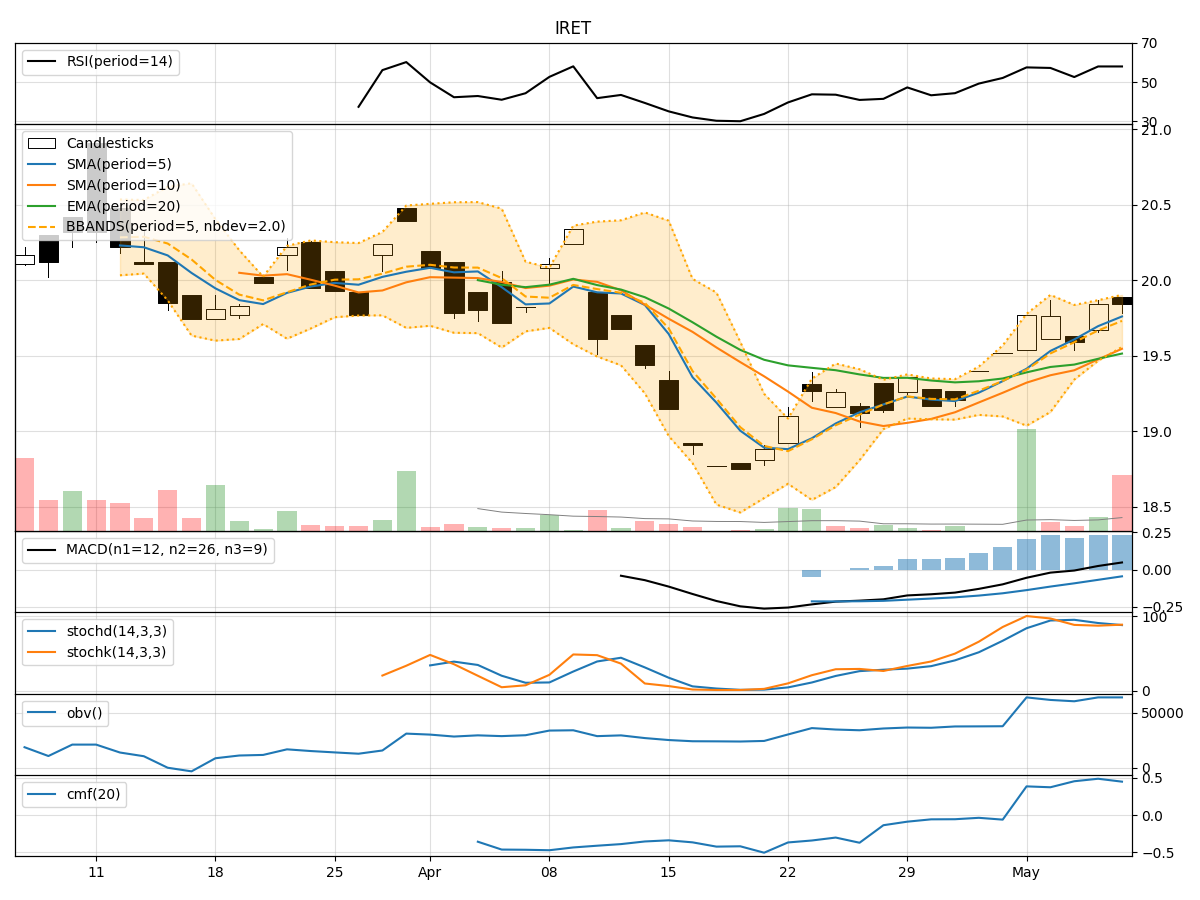
In analyzing the technical indicators for IRET over the last 5 days, we will delve into the trend, momentum, volatility, and volume indicators to provide a comprehensive outlook on the possible stock price movement in the coming days. By examining these key factors, we aim to offer valuable insights and predictions to guide your investment decisions.
Trend Analysis:
- Moving Averages (MA): The 5-day MA has been consistently below the closing prices, indicating a short-term downtrend.
- MACD: The MACD line has been below the signal line, suggesting a bearish momentum.
- EMA: The EMA has been declining, further supporting the bearish trend.
Key Observation: The trend indicators point towards a downward trajectory for IRET.
Momentum Analysis:
- RSI: The RSI has been fluctuating in the oversold region, indicating a lack of strong momentum.
- Stochastic Oscillator: Both %K and %D have been relatively low, signaling a weak buying pressure.
- Williams %R: The indicator has been consistently in the oversold territory, reflecting a bearish sentiment.
Key Observation: Momentum indicators suggest a lack of strong buying interest in the stock.
Volatility Analysis:
- Bollinger Bands (BB): The bands have been narrowing, indicating decreasing volatility.
- BB %B: The %B has been hovering around the lower band, signaling a potential oversold condition.
Key Observation: Volatility indicators point towards a stabilizing market environment.
Volume Analysis:
- On-Balance Volume (OBV): The OBV has shown mixed movements, reflecting indecision among investors.
- Chaikin Money Flow (CMF): The CMF has been relatively stable, suggesting a neutral money flow.
Key Observation: Volume indicators indicate a lack of clear direction in terms of investor sentiment.
Conclusion:
Based on the analysis of the technical indicators, the overall outlook for IRET in the next few days appears to be bearish. The trend indicators, momentum signals, and volume analysis collectively suggest a continuation of the downward movement in the stock price. While volatility is stabilizing, the lack of strong buying interest and the bearish sentiment portrayed by various indicators indicate a potential further decline in the stock price.
Key Conclusion: The stock is likely to experience further downward movement in the coming days. Investors should exercise caution and consider potential shorting opportunities or wait for a more favorable entry point before considering long positions.