Technical Analysis of ITDI 2024-05-31
Overview:
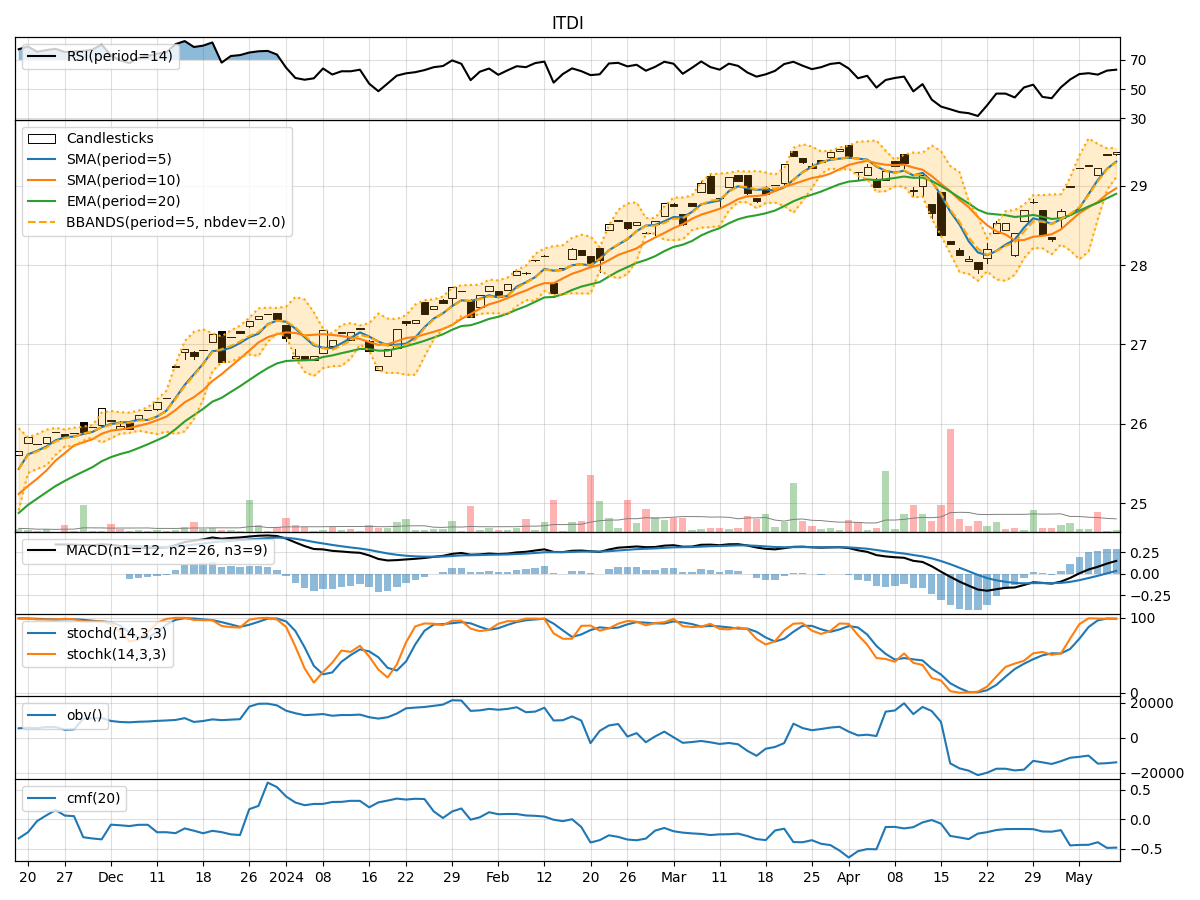
In analyzing the technical indicators for ITDI over the last 5 days, we will delve into the trend, momentum, volatility, and volume indicators to provide a comprehensive assessment of the stock's potential price movement. By examining these key factors, we aim to offer valuable insights and predictions for the next few days.
Trend Analysis:
- Moving Averages (MA): The 5-day MA has been fluctuating around the closing prices, indicating a relatively stable trend.
- MACD: The MACD line has been positive, albeit showing a slight decrease over the period.
- RSI: The RSI values have been moderate, suggesting neither overbought nor oversold conditions.
Key Observation: The trend indicators suggest a neutral to slightly bearish sentiment in the short term.
Momentum Analysis:
- Stochastic Oscillator: Both %K and %D values have been declining, indicating weakening momentum.
- Williams %R: The indicator has been consistently in oversold territory, signaling a potential reversal.
Key Observation: Momentum indicators point towards a bearish momentum in the near future.
Volatility Analysis:
- Bollinger Bands (BB): The bands have been narrowing, indicating decreasing volatility.
- BB %B: The %B values have been hovering around the midline, suggesting a lack of strong directional bias.
Key Observation: Volatility indicators suggest a period of consolidation or a potential breakout in the near term.
Volume Analysis:
- On-Balance Volume (OBV): The OBV values have been fluctuating, indicating mixed buying and selling pressure.
- Chaikin Money Flow (CMF): The CMF values have been positive, reflecting a net inflow of money into the stock.
Key Observation: Volume indicators show a lack of clear direction in terms of buying or selling pressure.
Conclusion:
Based on the analysis of the technical indicators, the next few days for ITDI are likely to see further downward movement in stock price. The trend indicators suggest a neutral to slightly bearish sentiment, while momentum indicators point towards a bearish momentum. Volatility indicators indicate a period of consolidation or a potential breakout, and volume indicators show mixed buying and selling pressure.
Overall Assessment: The stock is likely to experience a bearish trend in the coming days, with potential for increased volatility and a continuation of mixed trading volume. Traders should exercise caution and consider short-term selling strategies in anticipation of further price declines.