Technical Analysis of ITM 2024-05-31
Overview:
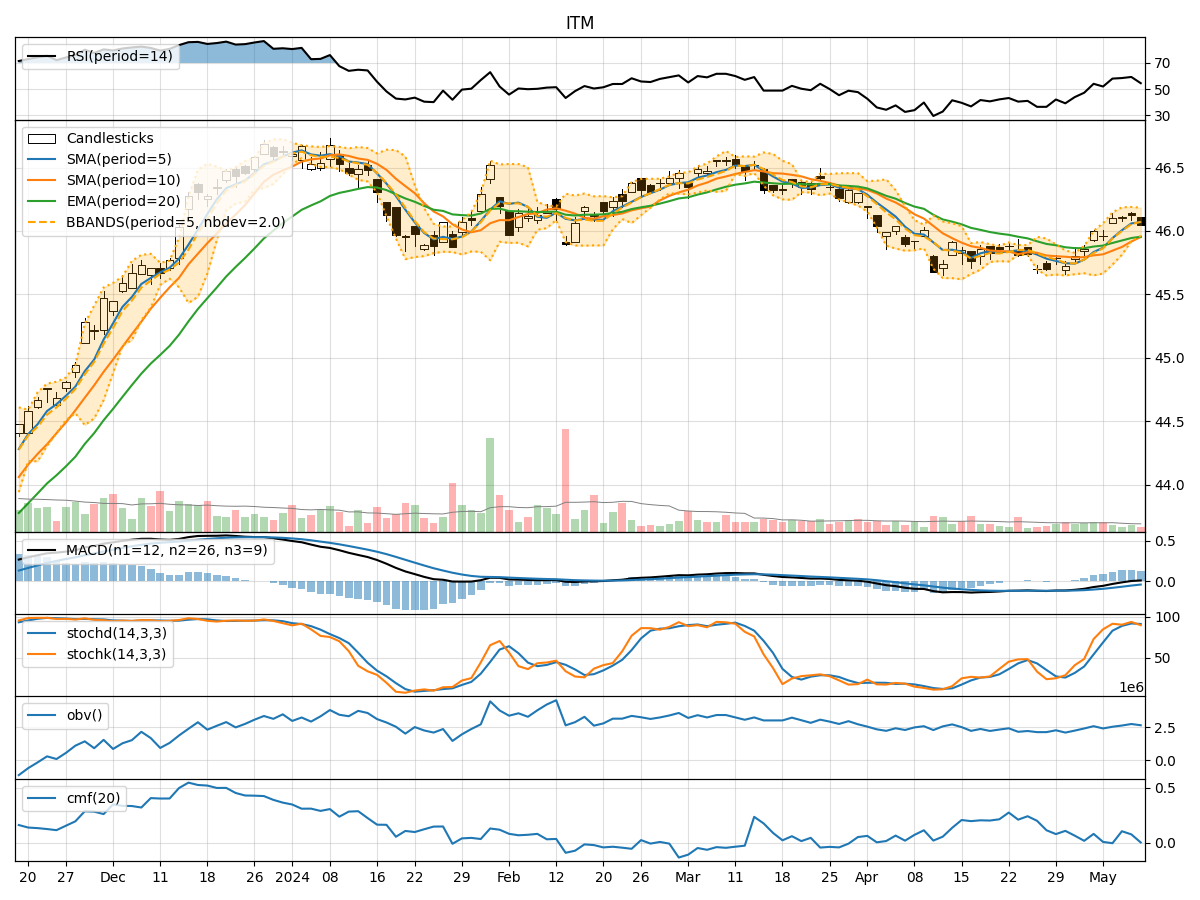
In analyzing the provided Technical Analysis (TA) data for the last 5 days of the ITM stock, we will delve into the trend, momentum, volatility, and volume indicators to derive insights into the possible future stock price movement. By examining these key indicators, we aim to provide a comprehensive analysis and make informed predictions for the upcoming trading days.
Trend Analysis:
- Moving Averages (MA): The 5-day Moving Average (MA) has been consistently below the closing price, indicating a downward trend.
- MACD: The Moving Average Convergence Divergence (MACD) has been negative and decreasing, suggesting bearish momentum.
- EMA: The Exponential Moving Average (EMA) has been declining, further supporting the bearish trend.
Momentum Analysis:
- RSI: The Relative Strength Index (RSI) has been in the oversold territory, indicating a potential reversal or continuation of the downtrend.
- Stochastic Oscillator: Both %K and %D have been low, signaling potential oversold conditions.
- Williams %R: The Williams %R has been in the oversold region, suggesting a possible bounce or continuation of the downtrend.
Volatility Analysis:
- Bollinger Bands (BB): The Bollinger Bands have been narrowing, indicating decreasing volatility.
- BB %B: The %B indicator has been decreasing, suggesting a potential consolidation phase.
- BB Width: The Bollinger Bands Width has been contracting, indicating reduced price volatility.
Volume Analysis:
- On-Balance Volume (OBV): The OBV has been negative, indicating selling pressure in the stock.
- Chaikin Money Flow (CMF): The CMF has been negative, reflecting outflow of money from the stock.
Key Observations and Opinions:
- Trend: The trend indicators point towards a downward trend in the stock price.
- Momentum: Momentum indicators suggest oversold conditions and a potential reversal or continuation of the downtrend.
- Volatility: Volatility indicators show decreasing volatility and a possible consolidation phase.
- Volume: Volume indicators indicate selling pressure and a negative money flow.
Conclusion:
Based on the analysis of the technical indicators, the next few days' possible stock price movement for ITM is likely to be bearish with a potential for further downside. Traders and investors should exercise caution and consider waiting for signs of a reversal or confirmation of a new trend before making any trading decisions. The stock is currently in a downtrend with oversold conditions, suggesting a possible bounce or continuation of the downward movement. It is advisable to closely monitor key support levels and wait for bullish confirmation before considering any long positions.