Technical Analysis of IUS 2024-05-31
Overview:
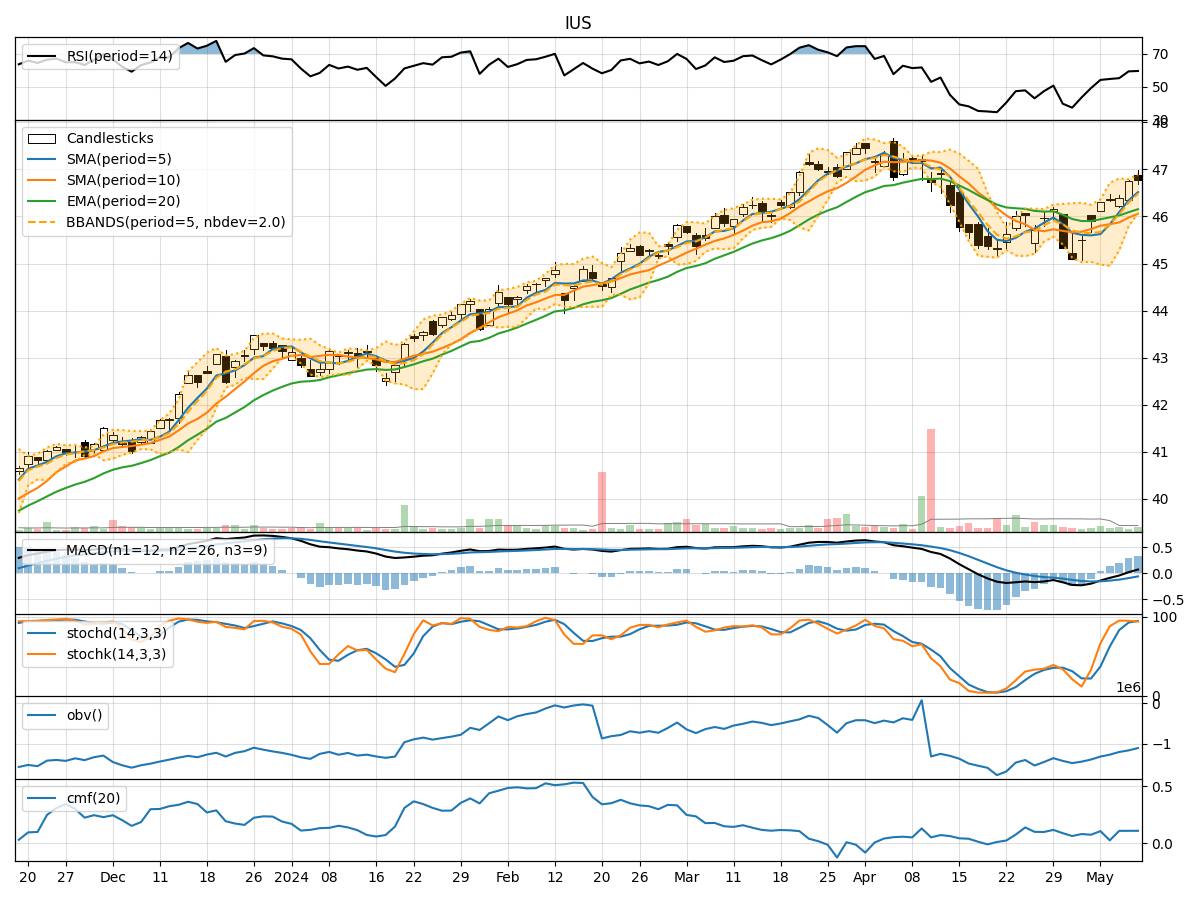
In analyzing the technical indicators for IUS stock over the last 5 days, we will delve into the trend, momentum, volatility, and volume indicators to provide a comprehensive outlook on the possible stock price movement in the coming days. By examining these key indicators, we aim to offer valuable insights and predictions to guide investment decisions.
Trend Analysis:
- Moving Averages (MA): The 5-day MA has been gradually decreasing, indicating a short-term bearish trend.
- MACD: The MACD line has been consistently positive, suggesting a bullish momentum.
- EMA: The EMA has been relatively stable, reflecting a neutral trend.
Key Observation: The trend indicators show mixed signals with a slight bearish bias in the short term.
Momentum Analysis:
- RSI: The RSI has been fluctuating within the neutral zone, indicating indecision in the market.
- Stochastic Oscillator: Both %K and %D have been declining, signaling a potential bearish momentum.
- Williams %R: The indicator has been in oversold territory, suggesting a possible reversal.
Key Observation: Momentum indicators point towards a weakening bullish momentum and a potential shift towards a bearish sentiment.
Volatility Analysis:
- Bollinger Bands (BB): The bands have been narrowing, indicating decreasing volatility.
Key Observation: Volatility has been decreasing, which could lead to a period of consolidation or a breakout in the near future.
Volume Analysis:
- On-Balance Volume (OBV): The OBV has been declining, suggesting selling pressure in the market.
- Chaikin Money Flow (CMF): The CMF has been negative, indicating a lack of buying interest.
Key Observation: Volume indicators reflect a bearish sentiment with more selling pressure than buying interest.
Conclusion:
Based on the analysis of the technical indicators, the overall outlook for IUS stock in the next few days leans towards a bearish sentiment. The trend indicators show a short-term bearish bias, while momentum indicators suggest a weakening bullish momentum and a possible shift towards bearish territory. Volatility is decreasing, indicating a potential period of consolidation, and volume indicators point towards more selling pressure in the market.
Key Conclusion: The stock is likely to experience a downward movement in the coming days, with a higher probability of a bearish trend. Traders and investors should exercise caution and consider implementing risk management strategies in their positions.