Technical Analysis of IWDL 2024-05-31
Overview:
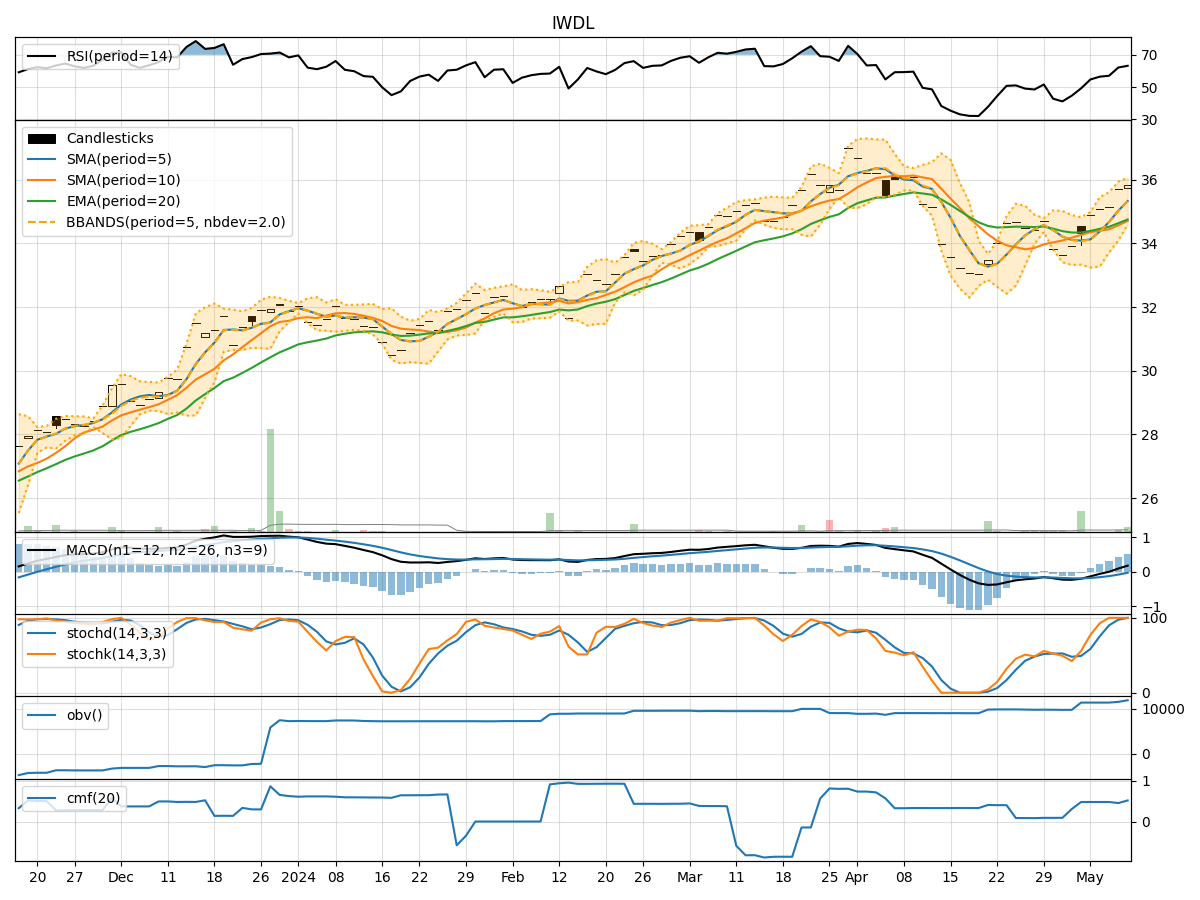
In analyzing the technical indicators for IWDL over the last 5 days, we will delve into the trend, momentum, volatility, and volume indicators to provide a comprehensive outlook on the possible stock price movement. By examining these key aspects, we aim to offer valuable insights and predictions for the upcoming days.
Trend Indicators:
- Moving Averages (MA): The 5-day MA has been consistently below the closing price, indicating a short-term downtrend.
- MACD: The MACD line has been positive but decreasing, while the MACD Histogram has been negative, suggesting a weakening bullish momentum.
- Conclusion: The trend indicators point towards a bearish sentiment in the short term.
Momentum Indicators:
- RSI: The RSI has been fluctuating around the neutral 50 level, indicating indecision in the market.
- Stochastic Oscillator: Both %K and %D have been in oversold territory, signaling a potential reversal.
- Conclusion: Momentum indicators suggest a neutral to slightly bearish outlook.
Volatility Indicators:
- Bollinger Bands (BB): The price has been trading within the bands, with the bands narrowing, indicating decreasing volatility.
- Conclusion: Volatility indicators imply a consolidation phase with reduced price fluctuations.
Volume Indicators:
- On-Balance Volume (OBV): The OBV has been declining, reflecting selling pressure in the market.
- Chaikin Money Flow (CMF): The CMF has been negative, indicating outflow of money from the stock.
- Conclusion: Volume indicators point towards a bearish sentiment with decreasing buying interest.
Overall Conclusion:
Based on the analysis of trend, momentum, volatility, and volume indicators, the overall outlook for IWDL in the next few days is bearish. The trend indicators suggest a downtrend, momentum indicators show a lack of strong buying interest, volatility indicators indicate a consolidation phase, and volume indicators reflect selling pressure. Therefore, it is likely that the stock price of IWDL may experience a downward movement in the upcoming days.
Recommendation:
Considering the bearish signals across multiple technical indicators, it is advisable to exercise caution when trading IWDL in the short term. Traders may consider implementing risk management strategies and closely monitoring key support levels for potential entry or exit points. Long-term investors may also reassess their positions based on the evolving market dynamics.