Technical Analysis of IWO 2024-05-31
Overview:
In the last 5 trading days, the stock price of IWO has shown some fluctuations, with a mix of bullish and bearish signals across various technical indicators. By analyzing the trend, momentum, volatility, and volume indicators, we can gain insights into the possible future price movement of IWO.
Trend Indicators:
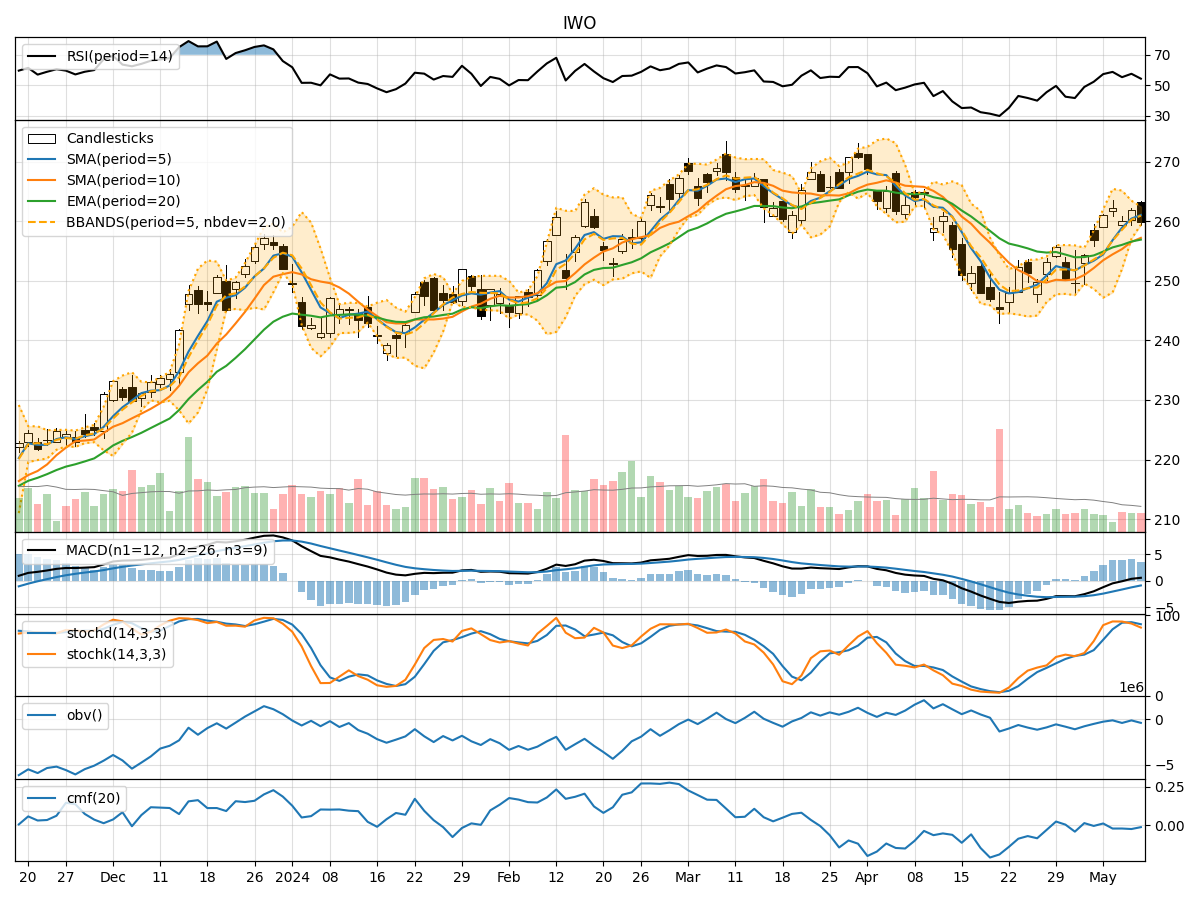
- Moving Averages (MA): The 5-day MA has been fluctuating around the closing prices, indicating short-term volatility. The SMA(10) and EMA(20) show a slight upward trend, suggesting potential bullish momentum.
- MACD: The MACD line has been decreasing slightly, but the MACD histogram remains positive, indicating a potential reversal or consolidation phase.
- RSI: The RSI has been fluctuating around the neutral zone, indicating indecision in the market sentiment.
Momentum Indicators:
- Stochastic Oscillator: Both %K and %D have been decreasing, indicating a bearish momentum in the short term.
- Williams %R: The indicator has been moving towards oversold territory, suggesting a potential buying opportunity.
Volatility Indicators:
- Bollinger Bands: The price has been trading within the bands, indicating a period of consolidation. The bands are narrowing, suggesting a potential breakout in the near future.
- Average True Range (ATR): ATR has been relatively stable, indicating consistent price movement.
Volume Indicators:
- On-Balance Volume (OBV): The OBV has been increasing, indicating accumulation by investors.
- Chaikin Money Flow (CMF): The CMF has been positive, suggesting buying pressure in the market.
Key Observations:
- The trend indicators show a potential bullish bias in the short term, supported by the moving averages.
- Momentum indicators suggest a bearish momentum in the short term, but the oversold condition indicated by Williams %R could lead to a reversal.
- Volatility indicators point towards a period of consolidation, with a potential breakout on the horizon.
- Volume indicators indicate accumulation and buying pressure in the market.
Conclusion:
Based on the analysis of the technical indicators, the next few days' possible stock price movement for IWO is likely to be sideways with a slight upward bias. Traders should watch for a potential breakout from the consolidation phase indicated by the narrowing Bollinger Bands. Investors may consider accumulating positions during any pullbacks, considering the positive OBV and CMF readings. It is essential to monitor key support and resistance levels for confirmation of the anticipated price movement.