Technical Analysis of IXUS 2024-05-31
Overview:
In analyzing the technical indicators for IXUS over the last 5 days, we will delve into the trend, momentum, volatility, and volume indicators to provide a comprehensive outlook on the possible stock price movement in the coming days. By examining these key aspects, we aim to offer valuable insights and recommendations for potential investors.
Trend Analysis:
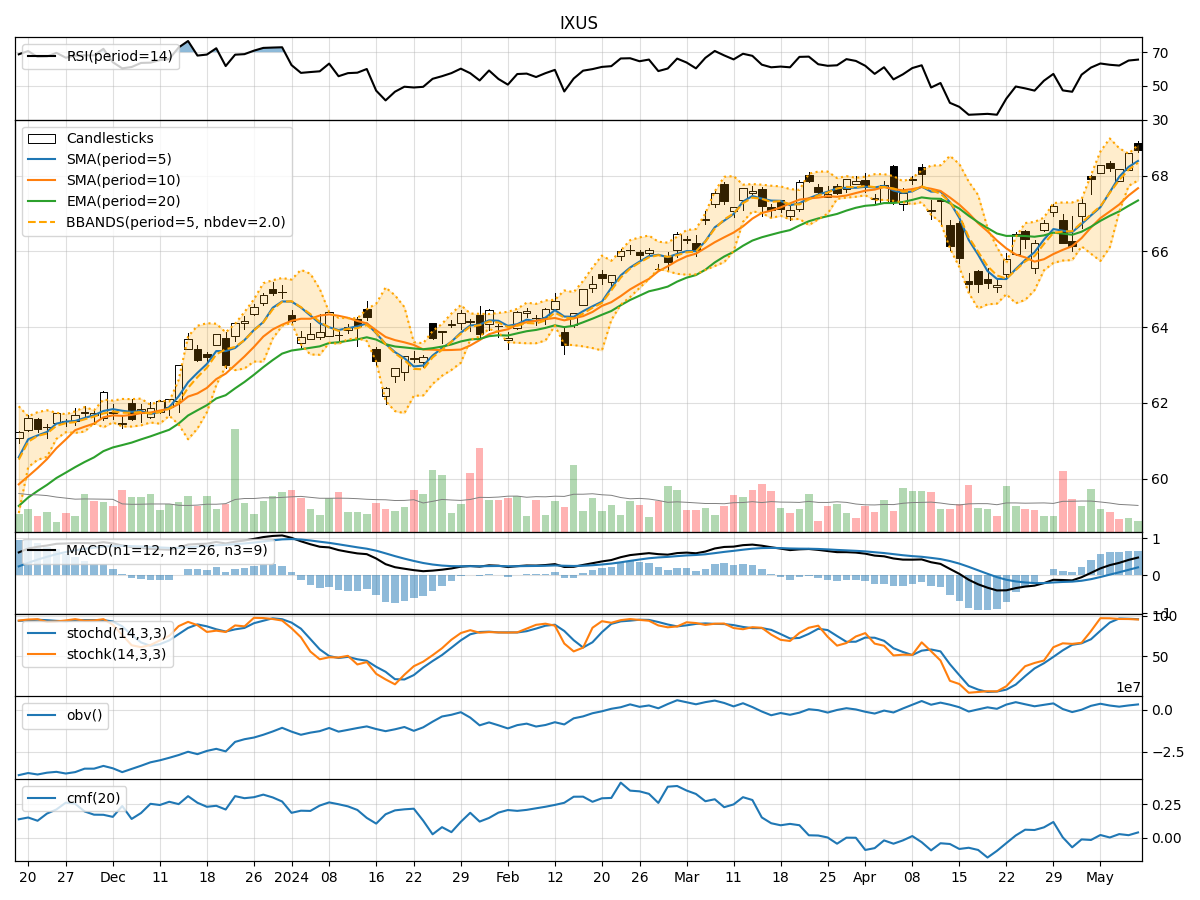
- Moving Averages (MA): The 5-day Moving Average (MA) has been fluctuating around the closing prices, indicating short-term price trends. The Simple Moving Average (SMA) and Exponential Moving Average (EMA) show a slight downward trend, suggesting a potential bearish sentiment.
- MACD: The Moving Average Convergence Divergence (MACD) and its signal line (MACDH) have been decreasing, indicating a weakening bullish momentum.
Momentum Analysis:
- RSI: The Relative Strength Index (RSI) has been fluctuating around the neutral zone, indicating indecision in the market.
- Stochastic Oscillator: Both %K and %D have been declining, suggesting a bearish momentum.
Volatility Analysis:
- Bollinger Bands (BB): The Bollinger Bands have been narrowing, indicating decreasing volatility and a potential price breakout in the near future.
Volume Analysis:
- On-Balance Volume (OBV): The OBV has been fluctuating, indicating mixed buying and selling pressure.
- Chaikin Money Flow (CMF): The CMF has been positive, suggesting a bullish money flow into the stock.
Key Observations:
- The trend indicators show a potential bearish sentiment with decreasing moving averages and MACD.
- Momentum indicators suggest a bearish momentum with declining RSI and Stochastic Oscillator.
- Volatility indicators point towards a potential price breakout due to narrowing Bollinger Bands.
- Volume indicators indicate mixed buying and selling pressure with a positive Chaikin Money Flow.
Conclusion:
Based on the analysis of the technical indicators, the outlook for IXUS in the next few days is bearish. The trend indicators, momentum indicators, and volatility indicators all point towards a potential downward movement in the stock price. Traders and investors should exercise caution and consider shorting or staying on the sidelines until a clearer trend emerges. It is advisable to closely monitor the price action and key support levels for potential entry or exit points.
Recommendation:
Given the bearish outlook, it is recommended to consider short-term trading strategies that align with the expected downward movement. Traders should set stop-loss orders to manage risk effectively and be prepared to adjust their positions based on evolving market conditions. Additionally, monitoring key technical levels and news developments can provide valuable insights for decision-making.
By carefully analyzing the technical indicators and market dynamics, investors can make informed decisions and navigate the stock market with confidence.