Technical Analysis of JBND 2024-05-31
Overview:
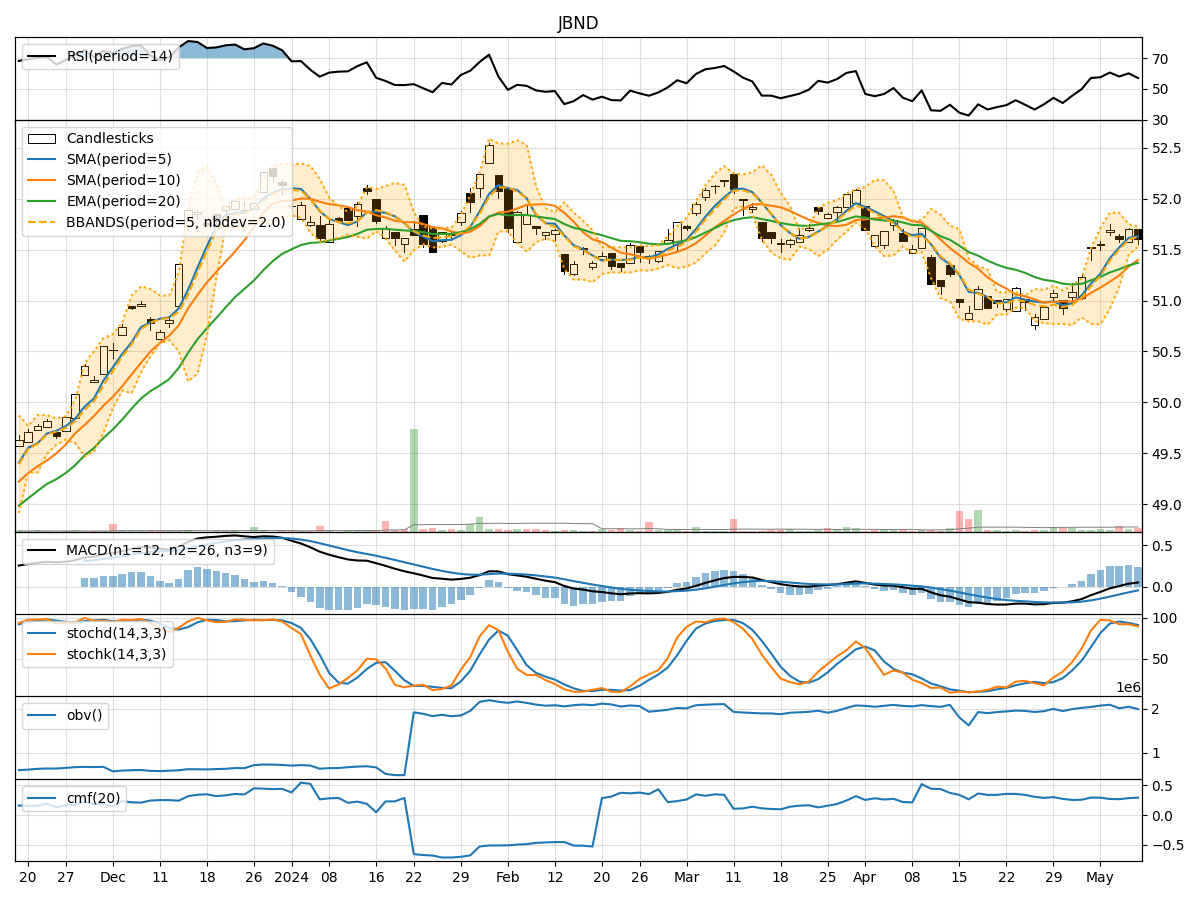
In analyzing the technical indicators for JBND stock over the last 5 days, we will delve into the trends, momentum, volatility, and volume indicators to provide a comprehensive outlook on the possible future stock price movement. By examining key metrics such as moving averages, MACD, RSI, Bollinger Bands, and OBV, we aim to offer valuable insights and recommendations for potential trading strategies.
Trend Analysis:
- Moving Averages (MA): The 5-day MA has been fluctuating around the closing prices, indicating a lack of clear trend direction.
- MACD: The MACD line has been hovering around the signal line, suggesting a neutral momentum.
Momentum Analysis:
- RSI: The RSI values have been oscillating around the mid-level, reflecting a balanced buying and selling pressure.
- Stochastic Oscillator: Both %K and %D values have been relatively low, indicating a potential oversold condition.
Volatility Analysis:
- Bollinger Bands (BB): The stock price has been trading within the bands, showing a moderate level of volatility.
Volume Analysis:
- On-Balance Volume (OBV): The OBV has shown mixed movements, indicating indecision among market participants.
Key Observations:
- The stock is currently in a sideways trend with no clear direction indicated by the moving averages and MACD.
- Momentum indicators like RSI and Stochastic Oscillator suggest a neutral sentiment with a slight inclination towards oversold conditions.
- Volatility remains moderate based on Bollinger Bands, indicating potential price fluctuations.
- Volume indicators show mixed signals with no strong confirmation of buying or selling pressure.
Conclusion:
Based on the analysis of the technical indicators, the next few days for JBND stock are likely to see sideways movement with a neutral bias. Traders may consider adopting a cautious approach and wait for clearer signals before making significant trading decisions. It is advisable to closely monitor key levels and wait for a more defined trend to emerge before taking substantial positions.