Technical Analysis of JSML 2024-05-31
Overview:
In analyzing the technical indicators for JSML over the last 5 days, we will delve into the trends, momentum, volatility, and volume indicators to provide a comprehensive outlook on the possible stock price movement in the coming days. By examining these key indicators, we aim to offer valuable insights and predictions for informed decision-making.
Trend Analysis:
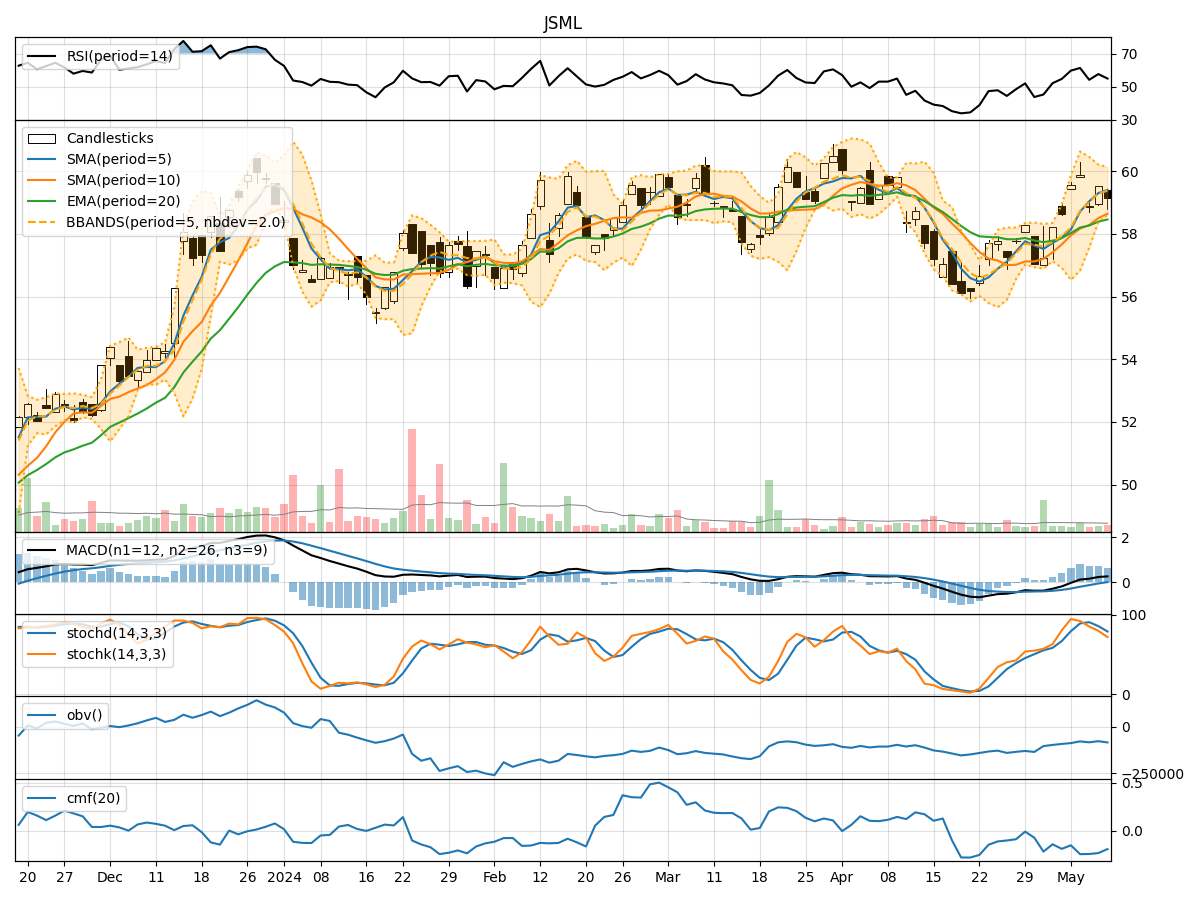
- Moving Averages (MA): The 5-day MA has been fluctuating around the closing prices, indicating short-term price trends. The SMA(10) and EMA(20) have shown a slight upward trend, suggesting potential bullish momentum.
- MACD: The MACD line has been positive, indicating a bullish trend. The MACD Histogram has been decreasing but remains above the zero line, signaling a potential slowdown in bullish momentum.
- Conclusion: The trend indicators suggest a bullish sentiment in the short term, with a possibility of a slight slowdown in momentum.
Momentum Analysis:
- RSI: The RSI has been fluctuating but generally above 50, indicating bullish momentum. However, it has not reached overbought levels, suggesting room for further upside.
- Stochastic Oscillator: Both %K and %D have been declining, indicating a potential reversal in momentum from overbought levels. The Williams %R is also in oversold territory.
- Conclusion: Momentum indicators suggest a mixed outlook, with a potential for a short-term pullback before resuming the bullish trend.
Volatility Analysis:
- Bollinger Bands (BB): The stock price has been trading within the bands, with the upper band acting as resistance and the lower band as support. The bands are narrowing, indicating decreasing volatility.
- Conclusion: Volatility indicators suggest a consolidation phase, with the potential for a breakout in either direction as the bands tighten.
Volume Analysis:
- On-Balance Volume (OBV): The OBV has been fluctuating but generally flat, indicating a balance between buying and selling pressure.
- Chaikin Money Flow (CMF): The CMF has been negative, suggesting a slight outflow of money from the stock.
- Conclusion: Volume indicators point towards a neutral stance, with no clear direction in buying or selling pressure.
Overall Conclusion:
Based on the analysis of trend, momentum, volatility, and volume indicators, the next few days for JSML stock price movement could see a consolidation phase with a slight bullish bias. Traders should monitor the key support and resistance levels indicated by the Bollinger Bands for potential breakout opportunities. Additionally, keeping an eye on the RSI for any signs of overbought conditions and the Stochastic Oscillator for potential reversal signals will be crucial in navigating the market dynamics.
In summary, while the short-term trend remains bullish, caution is advised due to the mixed signals from momentum indicators and the consolidation pattern indicated by volatility. It is essential for investors to stay vigilant and adapt their strategies accordingly to capitalize on potential opportunities while managing risks effectively.