Technical Analysis of JUNZ 2024-05-31
Overview:
In analyzing the technical indicators for JUNZ stock over the last 5 days, we will delve into the trend, momentum, volatility, and volume indicators to provide a comprehensive outlook on the possible stock price movement in the coming days. By examining these key indicators, we aim to offer valuable insights and predictions to guide your investment decisions.
Trend Analysis:
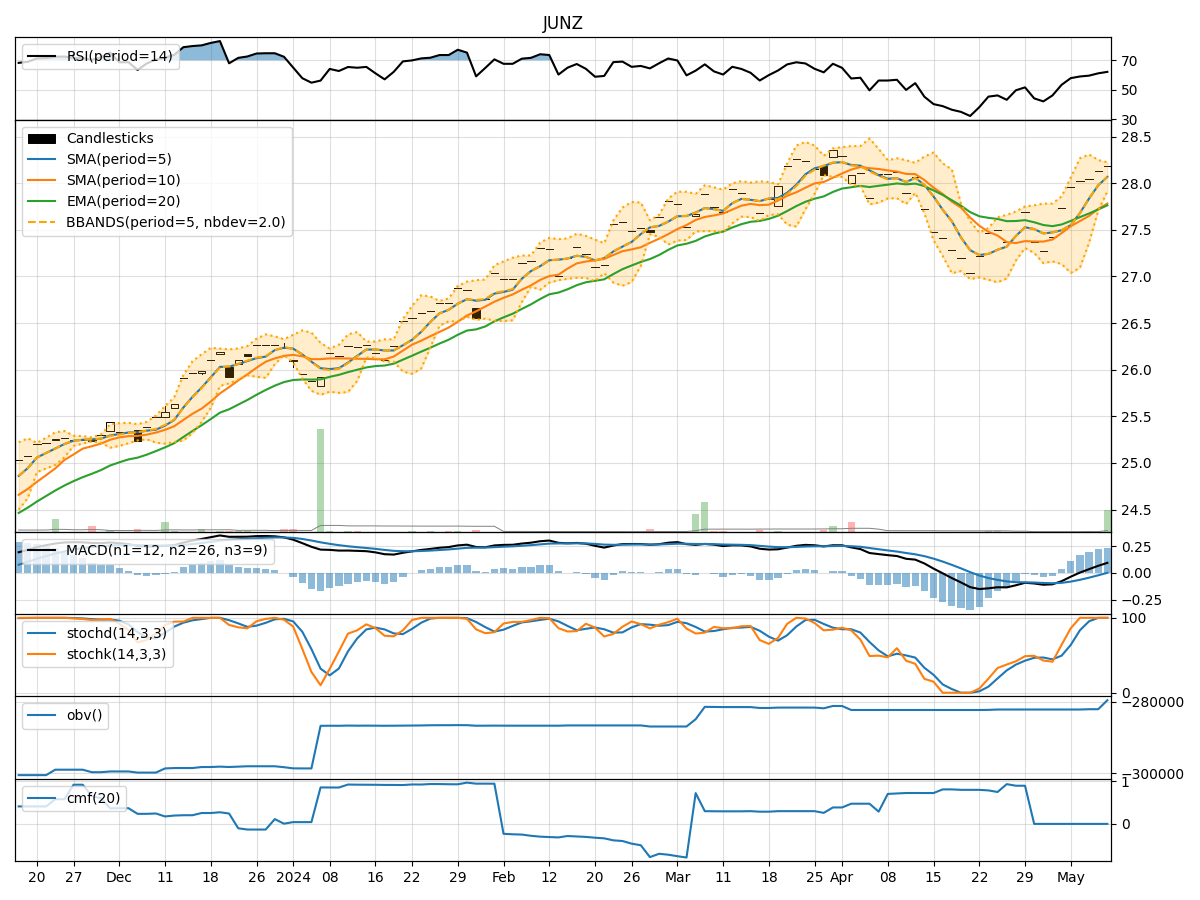
- Moving Averages (MA): The 5-day Moving Average (MA) has been fluctuating around the closing prices, indicating short-term price trends. The Simple Moving Average (SMA) and Exponential Moving Average (EMA) have shown slight variations but have generally been close to the closing prices.
- MACD and Signal Line: The MACD line has been positive, indicating a bullish momentum, although the MACD Histogram has shown a slight decrease in positive momentum over the last few days.
Momentum Analysis:
- RSI: The Relative Strength Index (RSI) has been fluctuating around the mid-level, suggesting a balanced momentum between buying and selling pressure.
- Stochastic Oscillator: Both %K and %D lines of the Stochastic Oscillator have been declining, indicating a potential shift towards oversold conditions.
- Williams %R: The Williams %R has been moving towards oversold territory, suggesting a possible reversal in the short term.
Volatility Analysis:
- Bollinger Bands (BB): The Bollinger Bands have been narrowing, indicating decreasing volatility in the stock price. The bands are relatively close to the moving average, suggesting a period of consolidation.
- Bollinger %B: The %B indicator has been fluctuating around the mid-level, reflecting the consolidation phase in the stock price.
Volume Analysis:
- On-Balance Volume (OBV): The OBV has shown mixed signals, with some days experiencing positive volume accumulation and others showing distribution. This indicates uncertainty in the buying and selling pressure.
- Chaikin Money Flow (CMF): The CMF has been negative, indicating a lack of buying pressure in the stock.
Conclusion:
Based on the analysis of the technical indicators, the stock price of JUNZ is likely to experience sideways movement in the coming days. The narrowing Bollinger Bands, fluctuating RSI, and declining Stochastic Oscillator suggest a period of consolidation with no clear trend direction. The lack of significant buying pressure indicated by the CMF and mixed signals from the OBV further support the view of sideways movement.
Key Conclusion: The stock is expected to trade within a range with no clear upward or downward bias in the near term. It is advisable to closely monitor the price action and wait for a breakout or a clearer trend signal before making any significant trading decisions.