Technical Analysis of KARS 2024-05-31
Overview:
In analyzing the technical indicators for KARS over the last 5 days, we will delve into the trend, momentum, volatility, and volume indicators to provide a comprehensive outlook on the possible stock price movement in the coming days. By examining these key aspects, we aim to offer valuable insights and predictions for potential investors.
Trend Analysis:
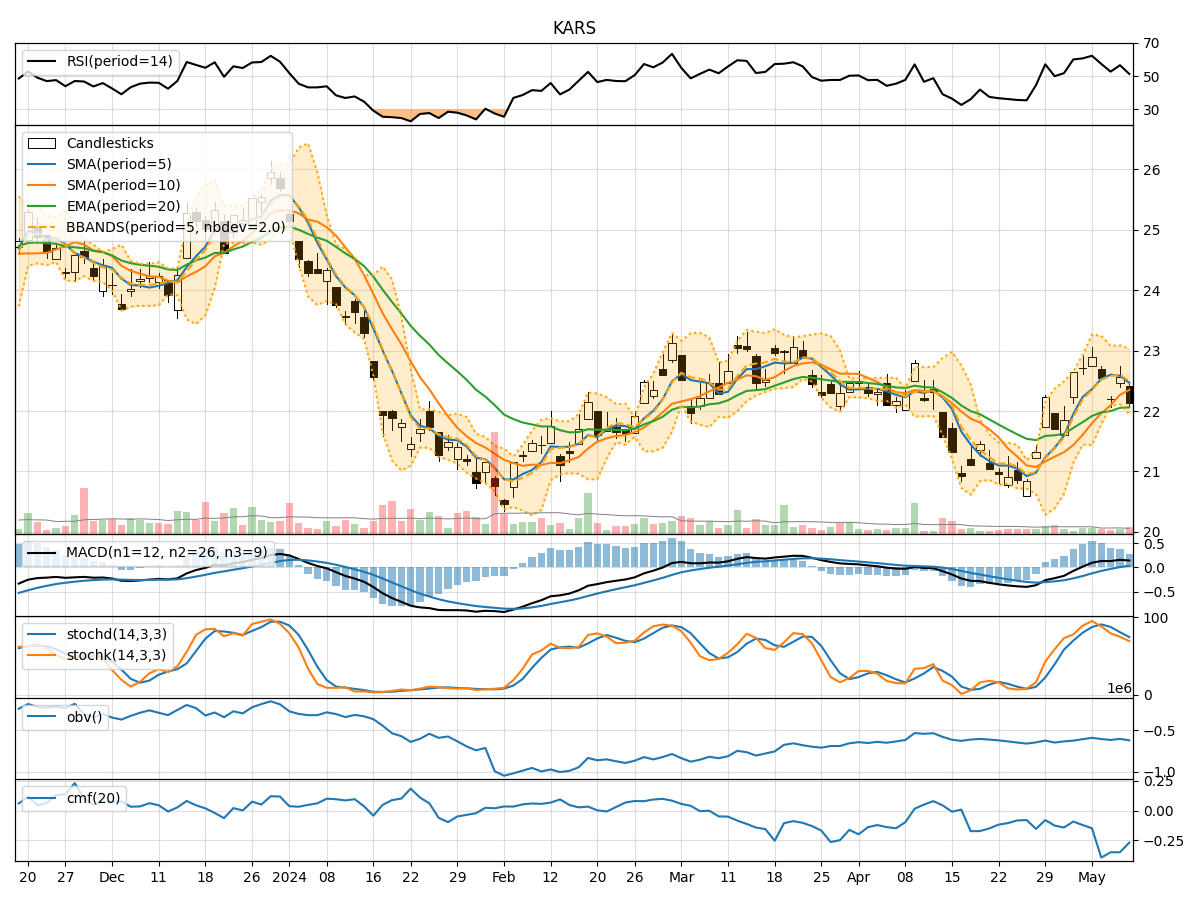
- Moving Averages (MA): The 5-day Moving Average (MA) has been consistently below the closing prices, indicating a short-term downtrend.
- MACD: The Moving Average Convergence Divergence (MACD) has been negative, suggesting a bearish momentum in the stock.
- EMA: The Exponential Moving Average (EMA) has been declining, further supporting the bearish trend.
Momentum Analysis:
- RSI: The Relative Strength Index (RSI) has been below 50, indicating a lack of strong momentum in either direction.
- Stochastic Oscillator: Both %K and %D have been relatively low, signaling a potential oversold condition.
- Williams %R: The Williams %R has been in the oversold territory, suggesting a possible reversal.
Volatility Analysis:
- Bollinger Bands (BB): The Bollinger Bands have been narrowing, indicating decreasing volatility in the stock.
- BB %B: The %B indicator has been hovering around the middle, reflecting a neutral stance in terms of volatility.
Volume Analysis:
- On-Balance Volume (OBV): The OBV has been fluctuating, showing mixed sentiment among investors.
- Chaikin Money Flow (CMF): The CMF has been negative, indicating selling pressure in the stock.
Key Observations:
- The stock is currently in a downtrend based on moving averages and MACD.
- Momentum indicators suggest a potential reversal due to oversold conditions.
- Volatility has been decreasing, indicating a possible period of consolidation.
- Volume indicators show mixed sentiment among investors.
Conclusion:
Based on the analysis of the technical indicators, the next few days for KARS stock could see a potential reversal in the downtrend. The oversold conditions indicated by momentum indicators, coupled with decreasing volatility and mixed volume sentiment, suggest a sideways movement or consolidation in the stock price. Investors should closely monitor key support and resistance levels for any signs of a bullish reversal or continuation of the downtrend.