Technical Analysis of KMET 2024-05-31
Overview:
In analyzing the technical indicators for KMET over the last 5 days, we will delve into the trend, momentum, volatility, and volume indicators to provide a comprehensive outlook on the possible stock price movement in the coming days. By examining these key indicators, we aim to offer valuable insights and predictions for potential investors.
Trend Analysis:
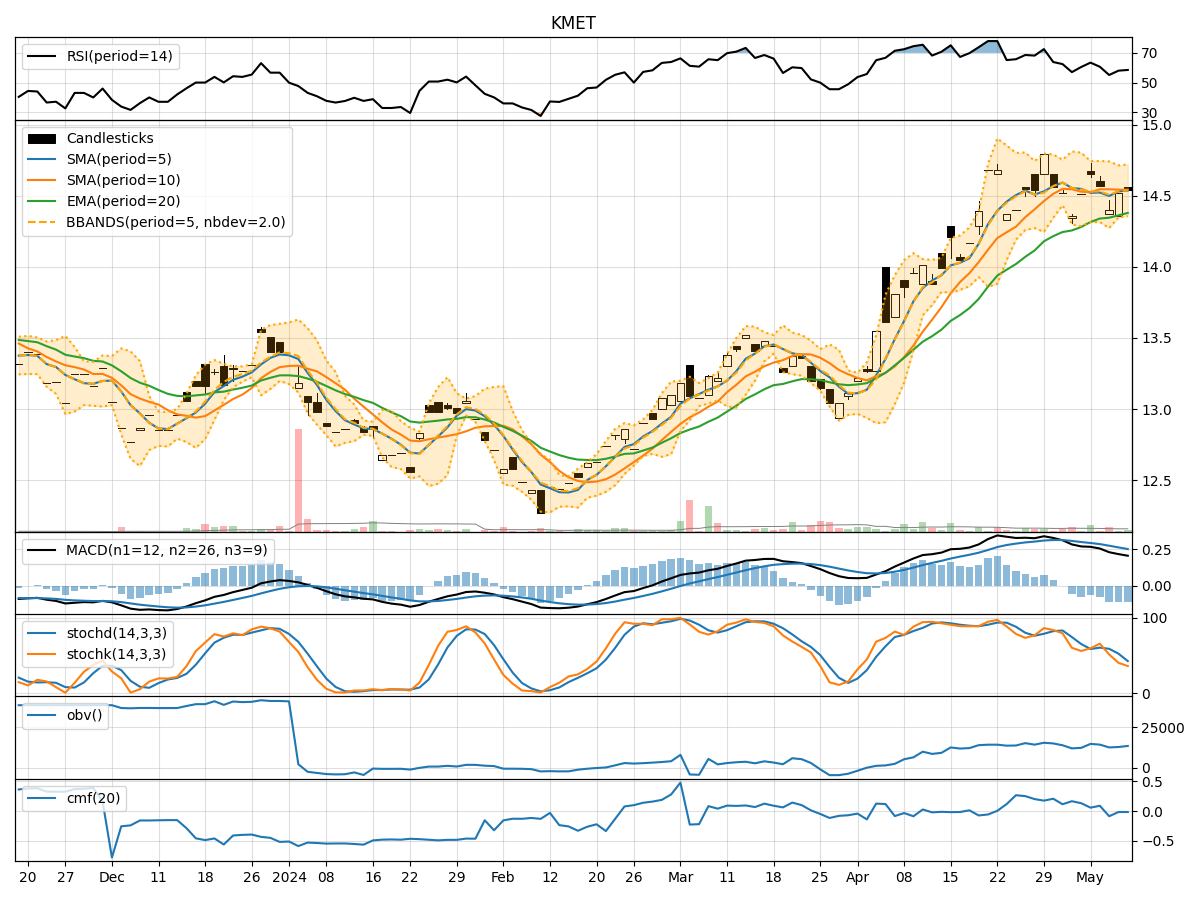
- Moving Averages (MA): The 5-day MA has been fluctuating around the closing prices, indicating short-term price trends. The SMA(10) and EMA(20) have shown a slight downward trend, suggesting a weakening momentum.
- MACD: The MACD line has been positive, but the MACD Histogram has been decreasing, signaling a potential bearish crossover.
- Conclusion: The trend indicators point towards a potential downward movement in the stock price.
Momentum Analysis:
- RSI: The RSI has been fluctuating around the neutral zone, indicating indecision in the market.
- Stochastic Oscillator: Both %K and %D have been moving erratically, reflecting uncertainty in price direction.
- Williams %R: The indicator has been in oversold territory, suggesting a possible reversal.
- Conclusion: The momentum indicators suggest a sideways movement or a potential reversal in the stock price.
Volatility Analysis:
- Bollinger Bands: The bands have been narrowing, indicating decreasing volatility.
- Conclusion: The volatility indicators suggest a decreasing volatility in the stock price.
Volume Analysis:
- On-Balance Volume (OBV): The OBV has been declining, indicating selling pressure in the market.
- Chaikin Money Flow (CMF): The CMF has been negative, suggesting outflow of money from the stock.
- Conclusion: The volume indicators point towards bearish sentiment in the market.
Overall Conclusion:
Based on the analysis of trend, momentum, volatility, and volume indicators, the overall outlook for KMET in the next few days is bearish. The trend indicators suggest a potential downward movement, while the momentum indicators indicate a sideways movement or a possible reversal. The volatility indicators point towards decreasing volatility, and the volume indicators reflect selling pressure and negative money flow.
Recommendation:
Considering the bearish outlook, investors should exercise caution and consider waiting for more clarity in the market before making any investment decisions. It is advisable to closely monitor the price action and key support levels for potential entry or exit points. Additionally, keeping an eye on any significant news or market developments that could impact the stock price is crucial.
Disclaimer:
This analysis is based solely on technical indicators and historical data, and it is important to note that market dynamics can change rapidly. It is recommended to conduct thorough research, consider fundamental factors, and consult with a financial advisor before making any investment decisions.