Technical Analysis of KRUZ 2024-05-31
Overview:
In analyzing the technical indicators for KRUZ stock over the last 5 days, we will delve into the trend, momentum, volatility, and volume indicators to provide a comprehensive outlook on the possible future stock price movement. By examining these key indicators, we aim to offer valuable insights and recommendations for potential investors.
Trend Indicators:
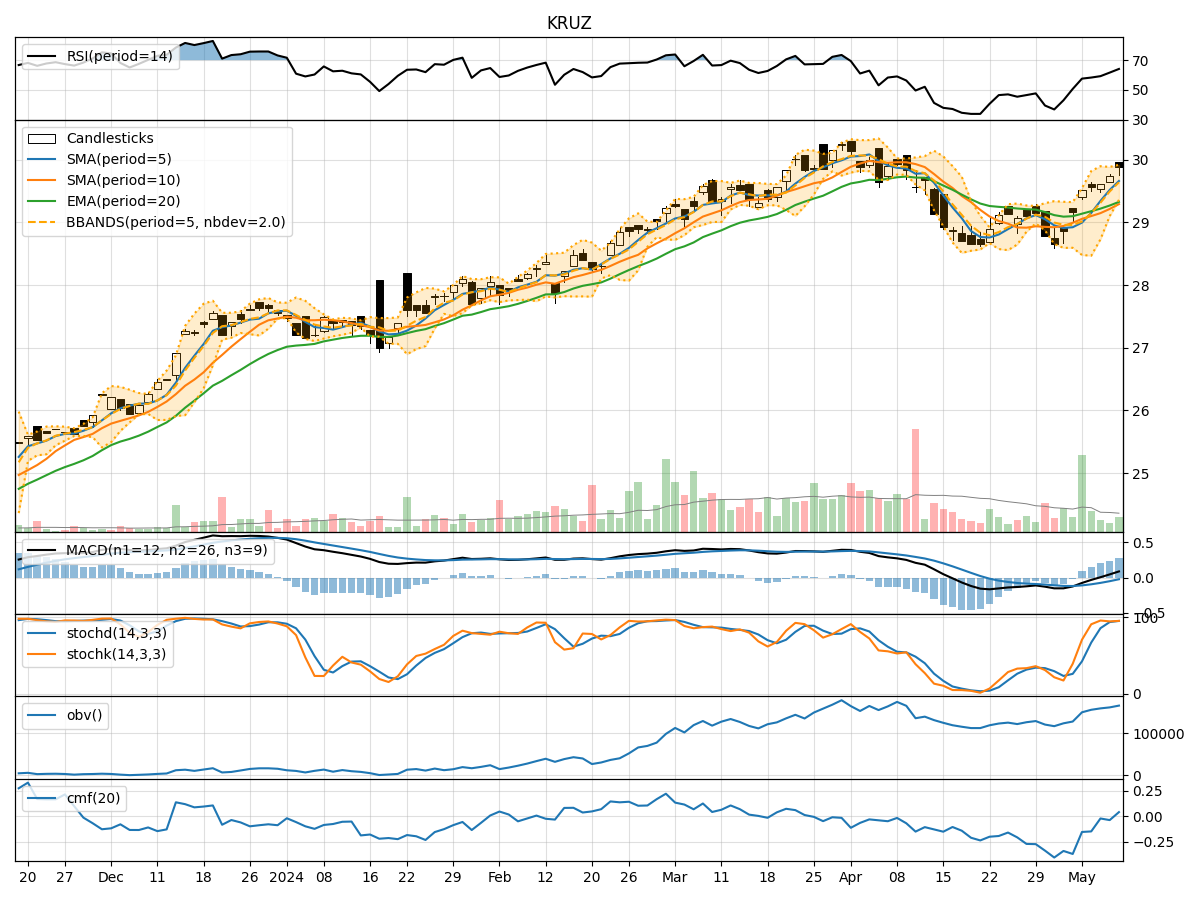
- Moving Averages (MA): The 5-day Moving Average (MA) has been fluctuating around the closing prices, indicating a short-term trend. Both the Simple Moving Average (SMA) and Exponential Moving Average (EMA) show a slight downward trend, suggesting a potential bearish sentiment.
- Moving Average Convergence Divergence (MACD): The MACD line has been hovering around the signal line, with the MACD Histogram showing a decreasing trend. This could signal a weakening bullish momentum.
Momentum Indicators:
- Relative Strength Index (RSI): The RSI has been oscillating in the neutral zone, indicating a lack of strong buying or selling pressure.
- Stochastic Oscillator: Both %K and %D lines of the Stochastic Oscillator have been declining, suggesting a bearish momentum.
- Williams %R (Willams %R): The Williams %R is in oversold territory, indicating a potential reversal or consolidation phase.
Volatility Indicators:
- Bollinger Bands (BB): The Bollinger Bands have been narrowing, indicating decreasing volatility. The price has been trading within the bands, suggesting a period of consolidation.
- Bollinger %B (BB %B): The %B indicator is hovering around the middle range, reflecting a balanced market sentiment.
Volume Indicators:
- On-Balance Volume (OBV): The OBV has shown mixed signals, with no clear trend in volume accumulation or distribution.
- Chaikin Money Flow (CMF): The CMF has been slightly positive, indicating some buying pressure but not strong enough to drive a significant price movement.
Key Observations:
- The trend indicators suggest a potential bearish sentiment in the short term.
- Momentum indicators point towards a weakening bullish momentum and a shift towards bearish territory.
- Volatility indicators indicate a period of consolidation with decreasing volatility.
- Volume indicators show mixed signals with no clear trend in volume accumulation.
Conclusion:
Based on the analysis of the technical indicators, the outlook for KRUZ stock in the next few days is bearish. The trend, momentum, and volume indicators all point towards a potential downward movement in the stock price. Traders and investors should exercise caution and consider waiting for more definitive signals before making any significant trading decisions.