Technical Analysis of LCTU 2024-05-31
Overview:
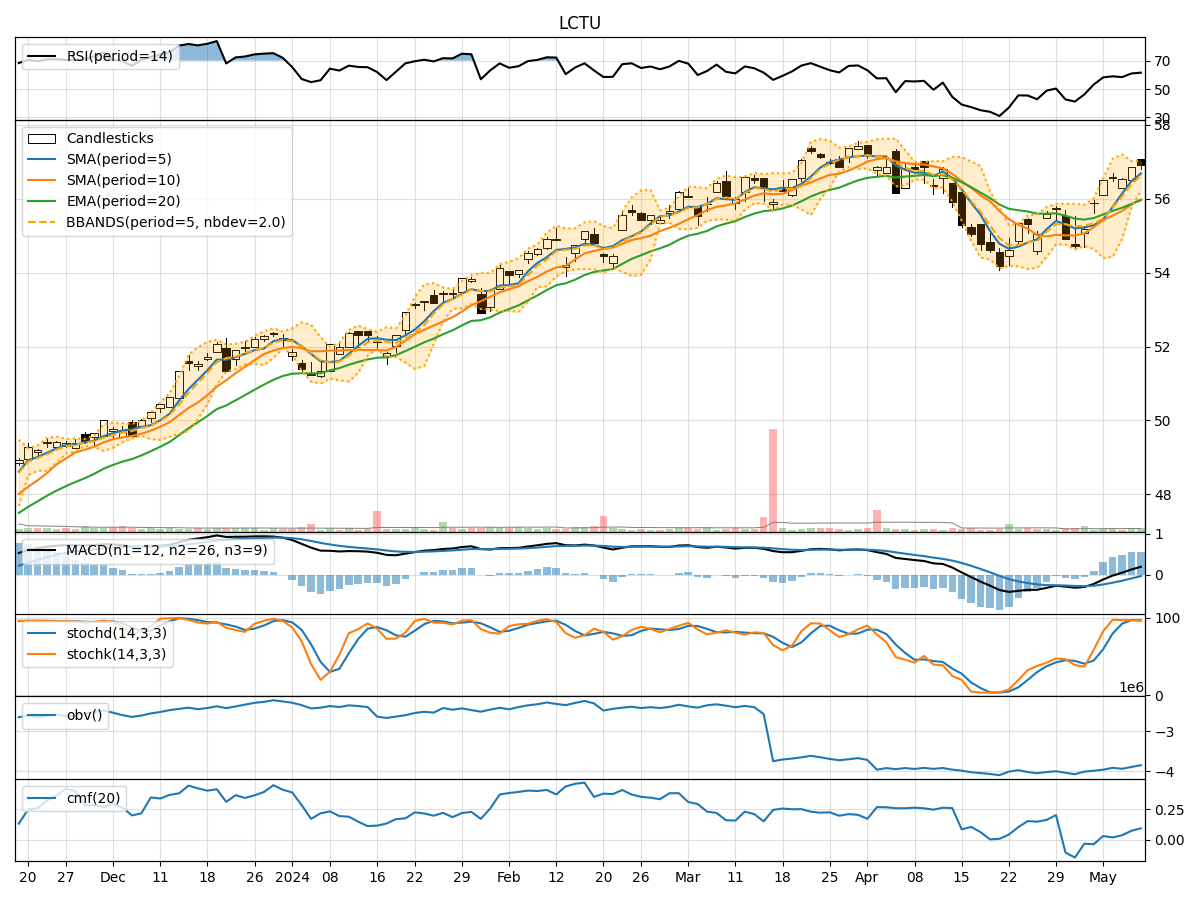
In analyzing the technical indicators for LCTU over the last 5 days, we will delve into the trend, momentum, volatility, and volume indicators to provide a comprehensive outlook on the possible stock price movement. By examining these key aspects, we aim to offer valuable insights and predictions for the upcoming days.
Trend Analysis:
- Moving Averages (MA): The 5-day MA has been relatively stable around the closing prices, indicating a consistent trend.
- MACD: The MACD line has shown a slight positive trend, with the MACD histogram hovering around the zero line.
- EMA: The EMA has been gradually increasing, suggesting a bullish sentiment in the short term.
Key Observation: The trend indicators point towards a slightly bullish outlook for LCTU.
Momentum Analysis:
- RSI: The RSI values have fluctuated but generally stayed within the neutral range, indicating a balanced momentum.
- Stochastic Oscillator: Both %K and %D have been declining, signaling a potential weakening momentum.
- Williams %R: The Williams %R values have been oscillating, reflecting indecision in momentum direction.
Key Observation: The momentum indicators suggest a neutral to slightly bearish momentum for LCTU.
Volatility Analysis:
- Bollinger Bands (BB): The bands have narrowed, indicating decreasing volatility in the stock price.
- Bollinger %B: The %B values have been relatively low, suggesting a potential consolidation phase.
- Average True Range (ATR): The ATR values have decreased, further confirming reduced volatility.
Key Observation: The volatility indicators signal a consolidation phase with reduced price fluctuations.
Volume Analysis:
- On-Balance Volume (OBV): The OBV values have shown a declining trend, indicating selling pressure.
- Chaikin Money Flow (CMF): The CMF values have been positive but decreasing, suggesting weakening buying pressure.
Key Observation: The volume indicators imply a bearish sentiment with decreasing buying interest.
Conclusion:
Based on the analysis of trend, momentum, volatility, and volume indicators, the overall outlook for LCTU in the next few days leans towards a sideways movement with a slightly bearish bias. While the trend indicators suggest a potential bullish sentiment, the momentum, volume, and volatility indicators point towards a more cautious approach due to weakening momentum, reduced buying interest, and lower volatility.
Key Conclusion: The next few days for LCTU are likely to see sideways consolidation with a bearish undertone. Traders should exercise caution and closely monitor key support and resistance levels for potential entry or exit points.