Technical Analysis of LGLV 2024-05-31
Overview:
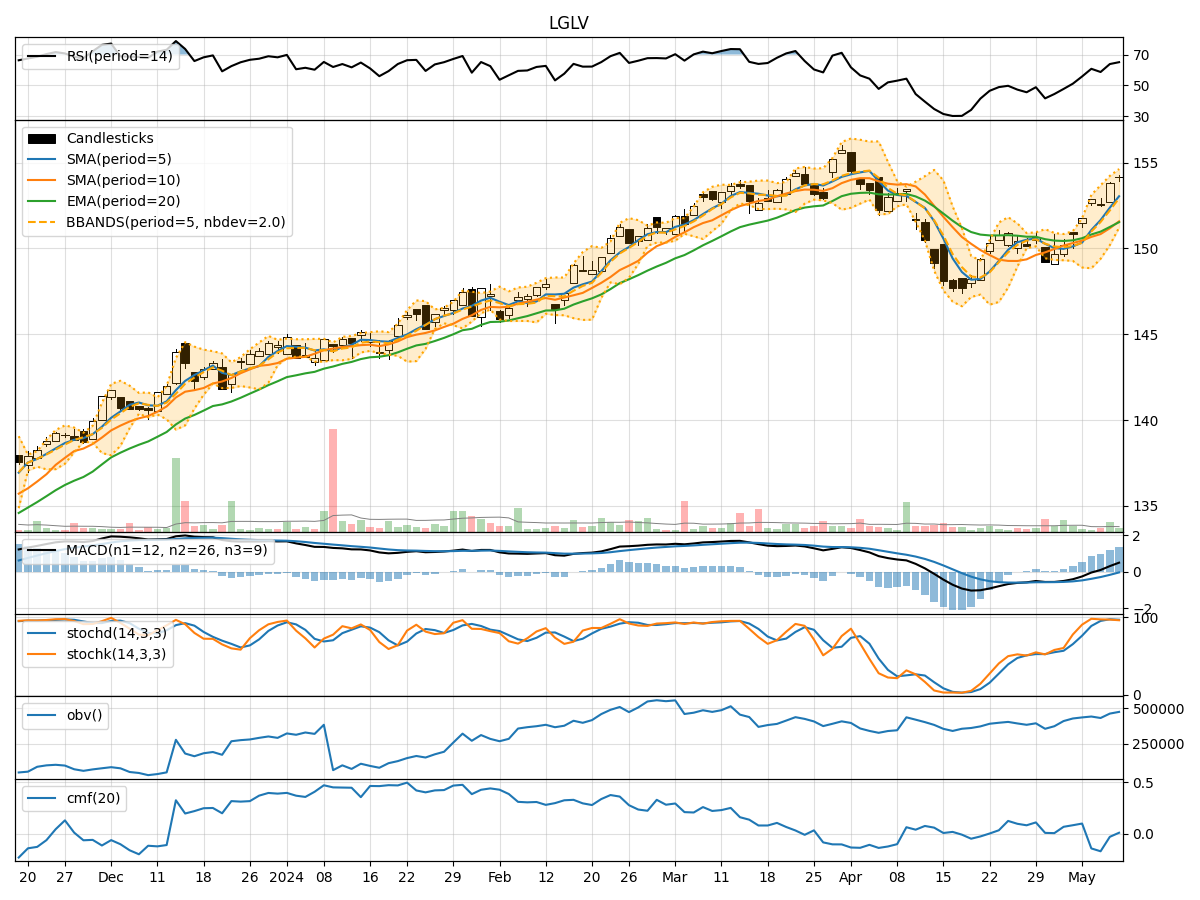
In analyzing the technical indicators for LGLV over the last 5 days, we will delve into the trend, momentum, volatility, and volume indicators to provide a comprehensive outlook on the possible stock price movement in the coming days.
Trend Analysis:
- Moving Averages (MA): The 5-day MA has been consistently below the closing price, indicating a short-term downtrend.
- MACD: The MACD line has been below the signal line, suggesting a bearish momentum.
- EMA: The EMA has been declining, further supporting the bearish trend.
Key Observation: The trend indicators point towards a downward trend in the stock price.
Momentum Analysis:
- RSI: The RSI has been fluctuating but is currently below 50, indicating a bearish momentum.
- Stochastic Oscillator: Both %K and %D have been in the oversold territory, signaling a potential reversal to the upside.
- Williams %R: The indicator has been consistently in the oversold region, suggesting a bearish sentiment.
Key Observation: Momentum indicators are mixed, with a slight bearish bias.
Volatility Analysis:
- Bollinger Bands (BB): The stock price has been trading below the lower Bollinger Band, indicating oversold conditions.
- Bollinger Band Width: The band width has been widening, suggesting increased volatility.
- Bollinger Band %B: The %B indicator is below 0.2, indicating an oversold condition.
Key Observation: Volatility indicators suggest an oversold market with increased volatility.
Volume Analysis:
- On-Balance Volume (OBV): The OBV has been fluctuating but is currently showing a slight uptick, indicating some buying pressure.
- Chaikin Money Flow (CMF): The CMF has been positive, suggesting money flow into the stock.
Key Observation: Volume indicators hint at potential buying interest in the stock.
Conclusion:
Based on the analysis of the technical indicators, the stock of LGLV is currently in a downtrend with a bearish bias in momentum. However, oversold conditions indicated by volatility indicators and the slight uptick in volume indicators suggest a possible reversal or consolidation in the near future.
Recommendation:
Considering the mixed signals from the indicators, investors should exercise caution. It may be prudent to wait for confirmation of a trend reversal before considering any long positions. Short-term traders could look for potential opportunities for a bounce from oversold levels. Monitoring key support and resistance levels will be crucial in determining the stock's next move.