Technical Analysis of LITP 2024-05-31
Overview:
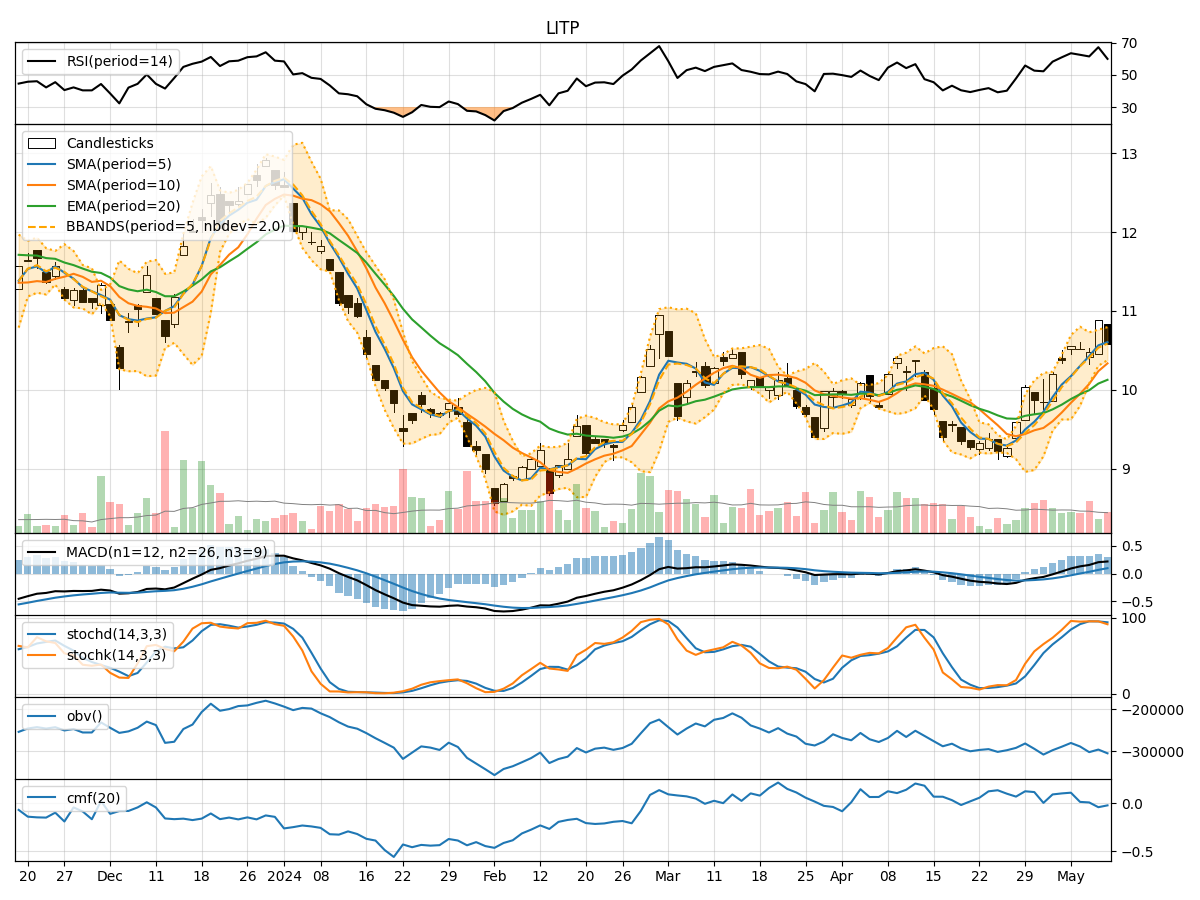
In analyzing the technical indicators for LITP over the last 5 days, we will delve into the trend, momentum, volatility, and volume indicators to provide a comprehensive outlook on the possible stock price movement in the coming days. By examining key metrics such as moving averages, MACD, RSI, Bollinger Bands, and OBV, we aim to offer valuable insights and predictions for potential price trends.
Trend Indicators:
- Moving Averages (MA): The 5-day MA has been consistently decreasing, indicating a downward trend in the short term.
- MACD: The MACD line has been above the signal line, suggesting a bullish momentum, but the gap is narrowing, signaling a potential reversal.
- EMA: The EMA has been declining, aligning with the bearish sentiment in the short term.
Momentum Indicators:
- RSI: The RSI has been decreasing, indicating a weakening momentum and potential oversold conditions.
- Stochastic Oscillator: Both %K and %D have been declining, signaling a bearish momentum.
- Williams %R: The indicator has been in oversold territory, suggesting a potential reversal or bounce.
Volatility Indicators:
- Bollinger Bands (BB): The stock price has been trading below the lower Bollinger Band, indicating oversold conditions and potential for a reversal.
- BB Width: The Bollinger Bands width has been expanding, suggesting increased volatility in the market.
- BB %B: The %B indicator is below 0.2, indicating an oversold condition.
Volume Indicators:
- On-Balance Volume (OBV): The OBV has been declining, suggesting selling pressure and potential bearish sentiment.
- Chaikin Money Flow (CMF): The CMF has been decreasing, indicating a decrease in buying pressure and potential bearish sentiment.
Key Observations:
- The trend indicators show a clear downward trend in the short term.
- Momentum indicators suggest a weakening momentum and potential for a reversal.
- Volatility indicators point towards oversold conditions and increased market volatility.
- Volume indicators indicate selling pressure and a decrease in buying sentiment.
Conclusion:
Based on the analysis of the technical indicators, the stock price of LITP is likely to continue its downward movement in the coming days. The combination of bearish trend, weakening momentum, oversold conditions, and selling pressure indicates a high probability of further price decline. Traders and investors should exercise caution and consider shorting or staying on the sidelines until a clear reversal signal emerges.