Technical Analysis of LVOL 2024-05-31
Overview:
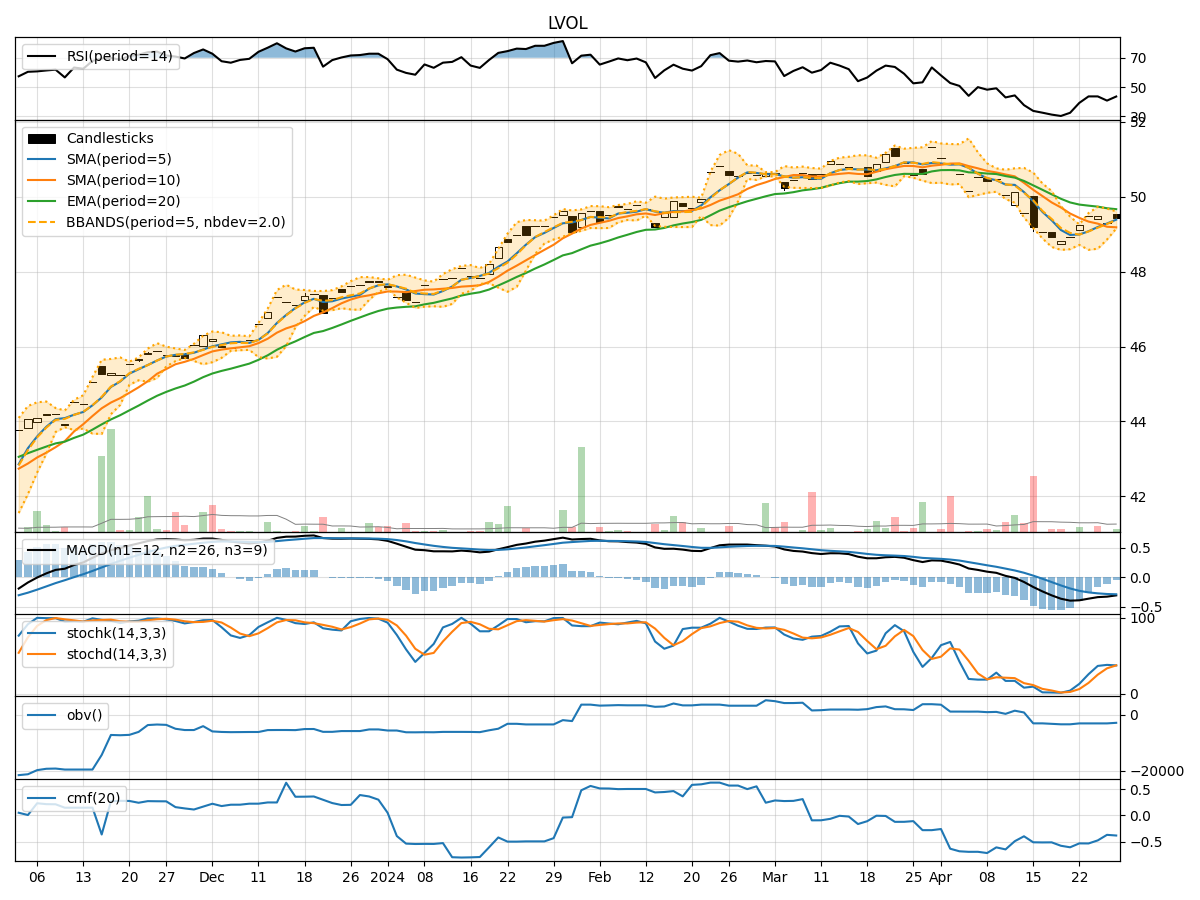
In the last 5 trading days, the stock price of LVOL has shown a slight decline from $50.50 to $50.08. The volume has fluctuated during this period, with some days showing higher volume than others. Various technical indicators across trend, momentum, volatility, and volume have been analyzed to provide insights into the possible future stock price movement.
Trend Analysis:
- Moving averages (MA) indicate a slight downward trend, with the 5-day MA below the 10-day simple moving average (SMA).
- Exponential moving average (EMA) shows a gradual decline in the stock price.
- MACD and MACD Histogram are positive but decreasing, suggesting a weakening bullish momentum.
Momentum Analysis:
- Relative Strength Index (RSI) has been decreasing, indicating a loss in bullish momentum.
- Stochastic Oscillator shows a bearish crossover, suggesting a potential reversal in price direction.
- Williams %R is in oversold territory, indicating a possible upcoming bounce.
Volatility Analysis:
- Bollinger Bands are narrowing, indicating decreasing volatility.
- Bollinger Band Percentage (BBP) is low, suggesting a potential breakout or significant price movement.
- Volatility indicators show a decrease in price fluctuations.
Volume Analysis:
- On-Balance Volume (OBV) has been negative, indicating distribution rather than accumulation.
- Chaikin Money Flow (CMF) is negative, showing selling pressure in the stock.
Key Observations:
- Trend: The stock is in a slight downtrend based on moving averages and EMA.
- Momentum: Momentum indicators suggest a weakening bullish momentum.
- Volatility: Volatility is decreasing, potentially leading to a period of consolidation.
- Volume: Negative OBV and CMF indicate selling pressure in the stock.
Conclusion:
Based on the analysis of technical indicators, the next few days for LVOL stock are likely to see further downward movement. The trend is bearish, momentum is weakening, and volume indicators suggest continued selling pressure. The narrowing Bollinger Bands and oversold Williams %R may lead to a short-term bounce, but the overall outlook remains bearish. Traders should exercise caution and consider shorting or staying on the sidelines until a clearer bullish signal emerges.