Technical Analysis of MBSF 2024-05-31
Overview:
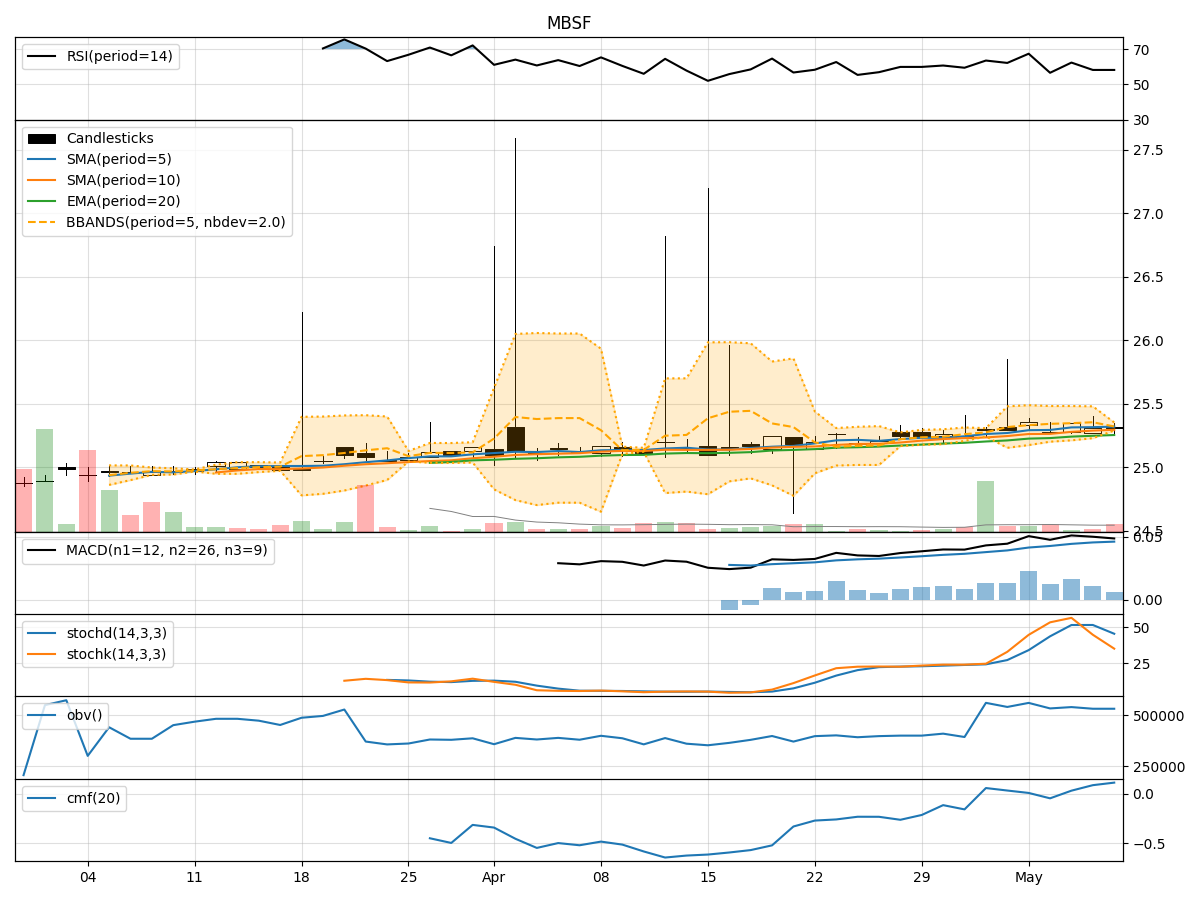
In analyzing the technical indicators for MBSF over the last 5 days, we will delve into the trend, momentum, volatility, and volume indicators to provide a comprehensive outlook on the possible stock price movement in the coming days. By examining these key aspects, we aim to offer valuable insights and recommendations for potential investors.
Trend Analysis:
- Moving Averages (MA): The 5-day MA has been relatively stable around the closing prices, indicating a consistent trend.
- MACD: The MACD line has shown slight fluctuations but has generally remained close to the signal line, suggesting a balanced momentum.
- RSI: The RSI values have fluctuated within the neutral range, indicating a lack of strong directional bias.
Key Observation: The trend indicators suggest a neutral to slightly bullish sentiment in the stock price movement.
Momentum Analysis:
- Stochastic Oscillator: Both %K and %D values have been fluctuating, indicating indecision in momentum.
- Williams %R: The values have consistently remained in the oversold territory, suggesting a potential reversal.
Key Observation: Momentum indicators reflect a mixed sentiment with a slight bearish bias.
Volatility Analysis:
- Bollinger Bands (BB): The bands have shown narrowing, indicating decreasing volatility.
- Bollinger %B: The %B values have fluctuated but have generally remained within the bands, suggesting stability.
Key Observation: Volatility indicators point towards a decrease in volatility and a potential period of consolidation.
Volume Analysis:
- On-Balance Volume (OBV): The OBV values have shown mixed trends, indicating uncertainty in volume accumulation.
- Chaikin Money Flow (CMF): The CMF values have been negative, suggesting a lack of buying pressure.
Key Observation: Volume indicators suggest a lack of strong volume confirmation to support a significant price movement.
Conclusion:
Based on the analysis of the technical indicators, the next few days' possible stock price movement for MBSF is likely to be sideways with a slight bearish bias. The trend indicators show a neutral to slightly bullish sentiment, while momentum indicators reflect a mixed sentiment with a slight bearish bias. Volatility indicators point towards decreasing volatility and a potential consolidation phase. Volume indicators suggest a lack of strong volume confirmation for a significant price movement.
Overall, the stock is expected to trade within a narrow range with a potential downside bias in the short term. Investors should exercise caution and closely monitor key support and resistance levels for potential trading opportunities.