Technical Analysis of MINT 2024-05-10
Overview:
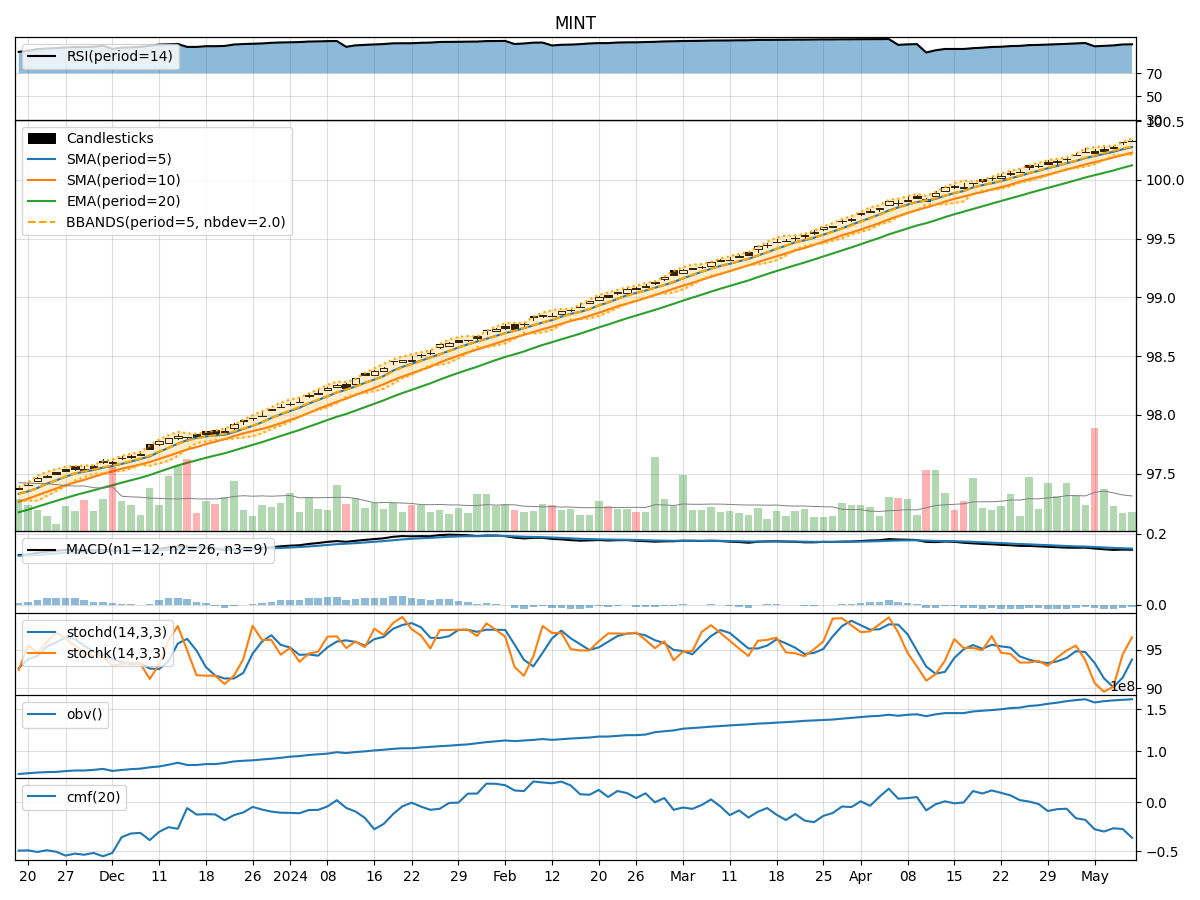
In analyzing the technical indicators for MINT stock over the last 5 days, we will delve into the trend, momentum, volatility, and volume indicators to provide a comprehensive outlook on the possible stock price movement in the coming days. By examining these key indicators, we aim to offer valuable insights and predictions for potential investors.
Trend Indicators:
- Moving Averages (MA): The 5-day moving average has been consistently above the closing prices, indicating a bullish trend.
- MACD: The MACD line has been negative but converging towards the signal line, suggesting a potential reversal in the bearish momentum.
- EMA: The exponential moving average has been steadily increasing, supporting the bullish sentiment.
Momentum Indicators:
- RSI: The Relative Strength Index has been in the overbought territory, signaling a strong bullish momentum.
- Stochastic Oscillator: Both %K and %D have been in the overbought zone, indicating a potential reversal or consolidation.
- Williams %R: The indicator has been fluctuating around the oversold region, suggesting a mixed sentiment.
Volatility Indicators:
- Bollinger Bands: The bands have been widening, indicating increased volatility in the stock price.
- Bollinger %B: The %B has been fluctuating, reflecting the price's relationship with the bands.
Volume Indicators:
- On-Balance Volume (OBV): The OBV has been increasing, suggesting accumulation by investors.
- Chaikin Money Flow (CMF): The CMF has been negative, indicating selling pressure in the stock.
Key Observations:
- The trend indicators point towards a bullish sentiment, supported by moving averages and EMA.
- Momentum indicators suggest a strong bullish momentum but also show signs of potential reversal or consolidation.
- Volatility has been increasing, indicating fluctuating price movements.
- Volume indicators reflect mixed signals with OBV showing accumulation but CMF indicating selling pressure.
Conclusion:
Based on the analysis of the technical indicators, the stock is likely to experience a continuation of the bullish trend in the short term. However, caution is advised as some momentum indicators suggest a potential reversal or consolidation. The increasing volatility may lead to sharp price movements, so investors should closely monitor the stock. Overall, a cautiously bullish view is recommended for the next few days.