Technical Analysis of MOAT 2024-05-31
Overview:
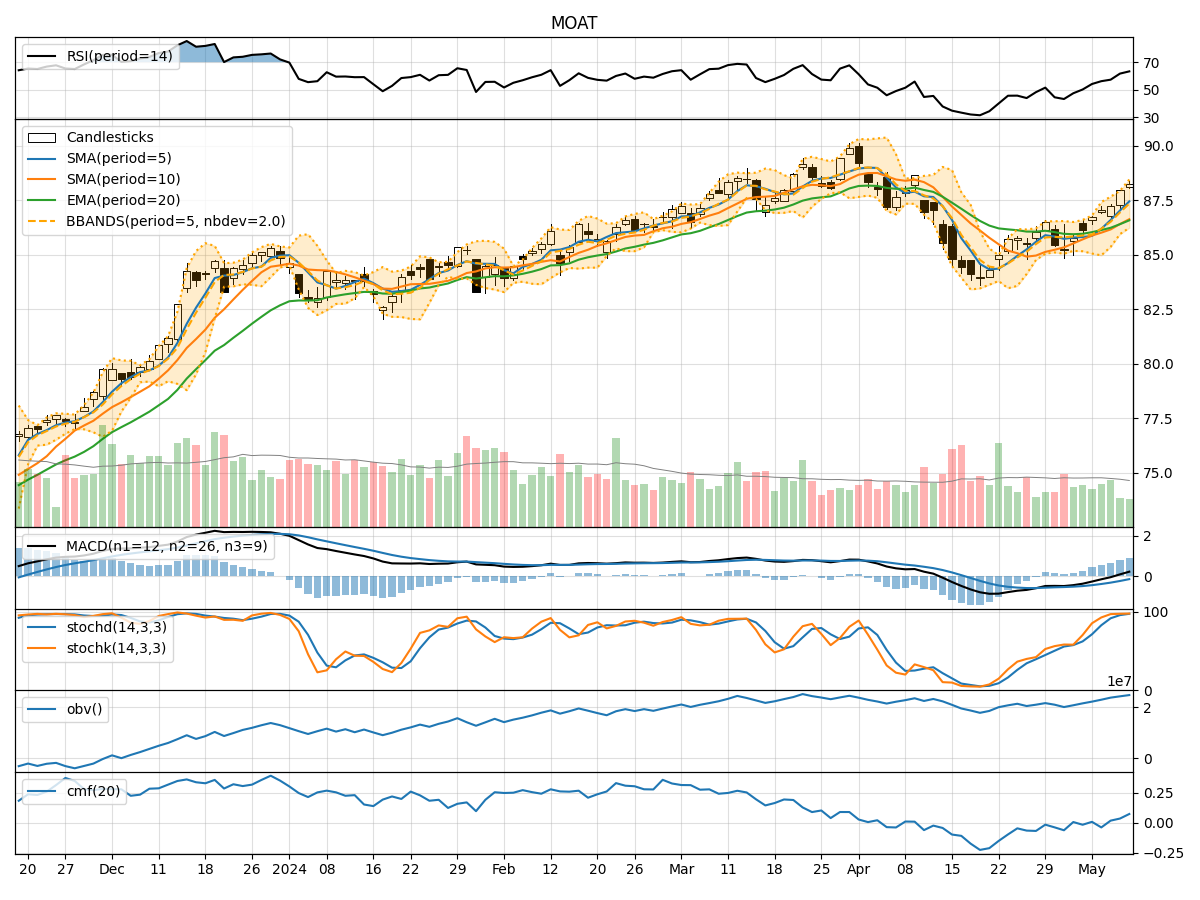
In analyzing the technical indicators for MOAT over the last 5 days, we will delve into the trend, momentum, volatility, and volume indicators to provide a comprehensive outlook on the possible stock price movement in the coming days.
Trend Analysis:
- Moving Averages (MA): The 5-day MA has been consistently decreasing, indicating a downward trend in the stock price.
- MACD: The MACD line has been negative, with the MACD histogram showing a decreasing trend, signaling a bearish momentum.
Momentum Analysis:
- RSI: The RSI has been declining, suggesting a weakening momentum in the stock.
- Stochastic Oscillator: Both %K and %D have been decreasing, indicating a bearish momentum.
Volatility Analysis:
- Bollinger Bands (BB): The stock price has been consistently below the middle Bollinger Band, indicating a lower volatility period.
Volume Analysis:
- On-Balance Volume (OBV): The OBV has been fluctuating, showing mixed sentiment in terms of volume accumulation.
- Chaikin Money Flow (CMF): The CMF has been positive, indicating buying pressure in the stock.
Key Observations:
- The stock is currently in a downtrend based on moving averages and MACD indicators.
- Momentum indicators like RSI and Stochastic Oscillator suggest a bearish sentiment in the stock.
- Volatility is relatively low, as indicated by the stock consistently trading below the middle Bollinger Band.
- Volume indicators show mixed signals, with OBV fluctuating and CMF indicating buying pressure.
Conclusion:
Based on the analysis of the technical indicators, the next few days' possible stock price movement for MOAT is likely to be downward. The stock is currently in a bearish trend, supported by momentum indicators and the MACD analysis. Additionally, the low volatility environment suggests a lack of significant price movements in the near term. Traders and investors should exercise caution and consider potential short-term selling opportunities or wait for a more favorable entry point.