Technical Analysis of MSTB 2024-05-31
Overview:
In analyzing the technical indicators for MSTB over the last 5 days, we will delve into the trend, momentum, volatility, and volume indicators to provide a comprehensive outlook on the possible stock price movement in the coming days. By examining these key indicators, we aim to offer valuable insights and predictions for informed decision-making.
Trend Analysis:
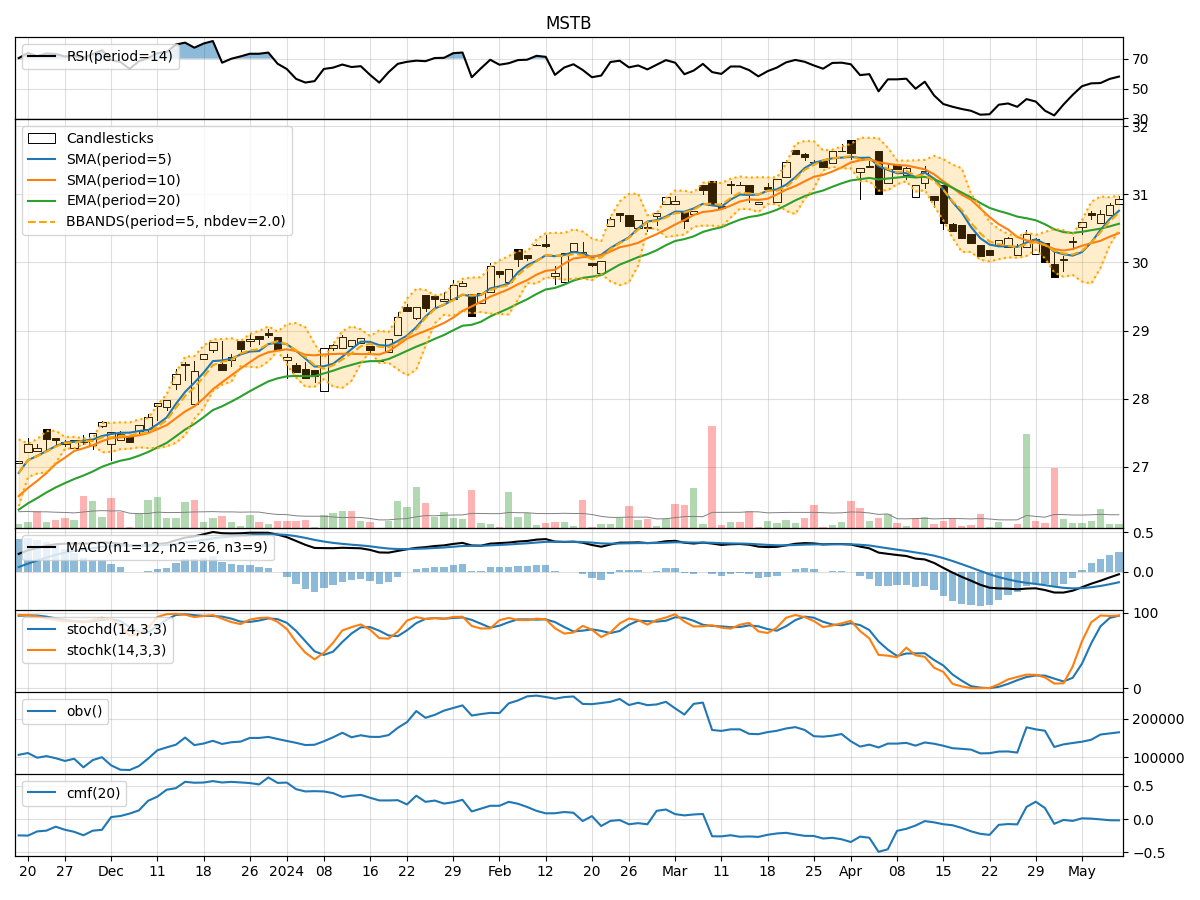
- Moving Averages (MA): The 5-day Moving Average (MA) has been fluctuating around the closing prices, indicating short-term price trends. The Simple Moving Average (SMA) and Exponential Moving Average (EMA) show a slight upward trend, with the EMA slightly above the SMA.
- Moving Average Convergence Divergence (MACD): The MACD and Signal Line are positive, suggesting a bullish momentum in the short term.
Momentum Analysis:
- Relative Strength Index (RSI): The RSI has been oscillating around the mid-level, indicating a neutral momentum in the stock.
- Stochastic Oscillator: Both %K and %D have been declining, signaling a potential bearish momentum.
- Williams %R (Willams %R): The Williams %R is in the oversold territory, suggesting a possible reversal in the short term.
Volatility Analysis:
- Bollinger Bands (BB): The stock price has been trading within the Bollinger Bands, with the bands narrowing, indicating decreasing volatility.
- Bollinger Band %B (BB %B): The %B is hovering around the mid-level, reflecting a neutral volatility outlook.
Volume Analysis:
- On-Balance Volume (OBV): The OBV has been fluctuating negatively, indicating distribution in the stock.
- Chaikin Money Flow (CMF): The CMF is negative, suggesting a bearish sentiment in the stock.
Key Observations:
- The trend indicators show a slight bullish bias in the short term.
- Momentum indicators suggest a mixed sentiment with a potential bearish bias.
- Volatility indicators point towards decreasing volatility in the stock.
- Volume indicators indicate a distribution phase in the stock.
Conclusion:
Based on the analysis of the technical indicators, the next few days' possible stock price movement for MSTB is likely to experience a consolidation phase with a slight downward bias. Traders should exercise caution and closely monitor key support and resistance levels for potential entry or exit points. It is advisable to wait for further confirmation from the indicators before making significant trading decisions.