Technical Analysis of MUSI 2024-05-31
Overview:
In analyzing the technical indicators for MUSI stock over the last 5 days, we will delve into the trend, momentum, volatility, and volume indicators to provide a comprehensive outlook on the possible stock price movement in the coming days. By examining these key indicators, we aim to offer valuable insights and predictions for potential investors.
Trend Indicators:
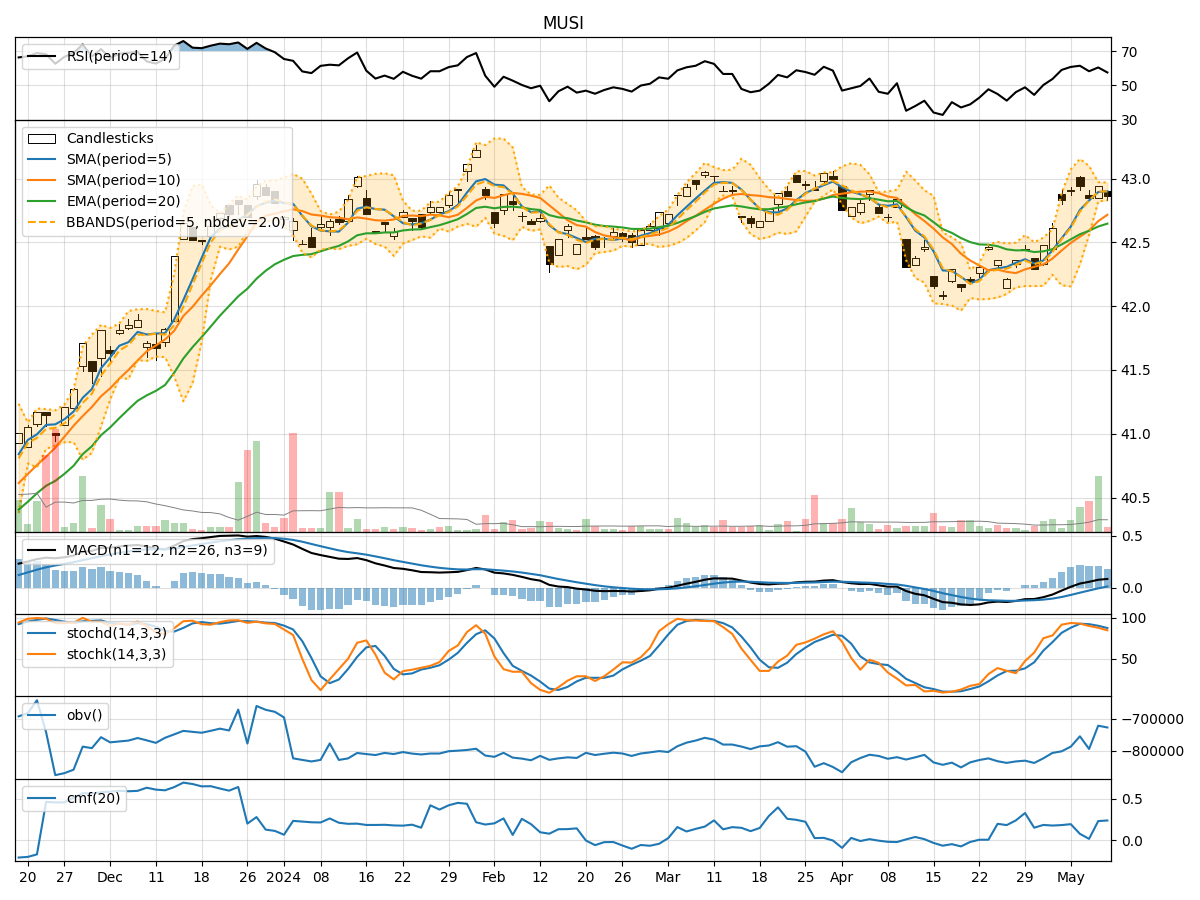
- Moving Averages (MA): The 5-day moving average (MA) has been consistently below the simple moving average (SMA) and exponential moving average (EMA) over the past 5 days, indicating a downward trend.
- MACD: The MACD line has been positive but decreasing, while the MACD histogram has been negative, suggesting a potential reversal or consolidation phase.
Momentum Indicators:
- RSI: The Relative Strength Index (RSI) has been fluctuating around the neutral 50 level, indicating indecision in the market.
- Stochastic Oscillator: Both %K and %D have been in oversold territory, signaling a potential buying opportunity.
Volatility Indicators:
- Bollinger Bands (BB): The stock price has been trading within the Bollinger Bands, with the bands narrowing, indicating decreasing volatility.
Volume Indicators:
- On-Balance Volume (OBV): The OBV has been negative, suggesting distribution of the stock.
- Chaikin Money Flow (CMF): The CMF has been consistently negative, indicating selling pressure.
Key Observations:
- The trend indicators suggest a bearish sentiment with the moving averages pointing downwards.
- Momentum indicators show mixed signals with RSI hovering around 50 and stochastic oscillators in oversold territory.
- Volatility indicators indicate decreasing volatility, potentially leading to a period of consolidation.
- Volume indicators reflect selling pressure as both OBV and CMF are negative.
Conclusion:
Based on the analysis of the technical indicators, the stock price of MUSI is likely to experience further downward movement in the coming days. The bearish trend, coupled with selling pressure and decreasing volatility, indicates a potential continuation of the current downtrend. Investors should exercise caution and consider waiting for more definitive signals before making any buying decisions.