Technical Analysis of MVV 2024-05-31
Overview:
In analyzing the technical indicators for MVV over the last 5 days, we will delve into the trend, momentum, volatility, and volume indicators to provide a comprehensive outlook on the possible stock price movement in the coming days. By examining these key aspects, we aim to offer valuable insights and predictions to guide your investment decisions.
Trend Analysis:
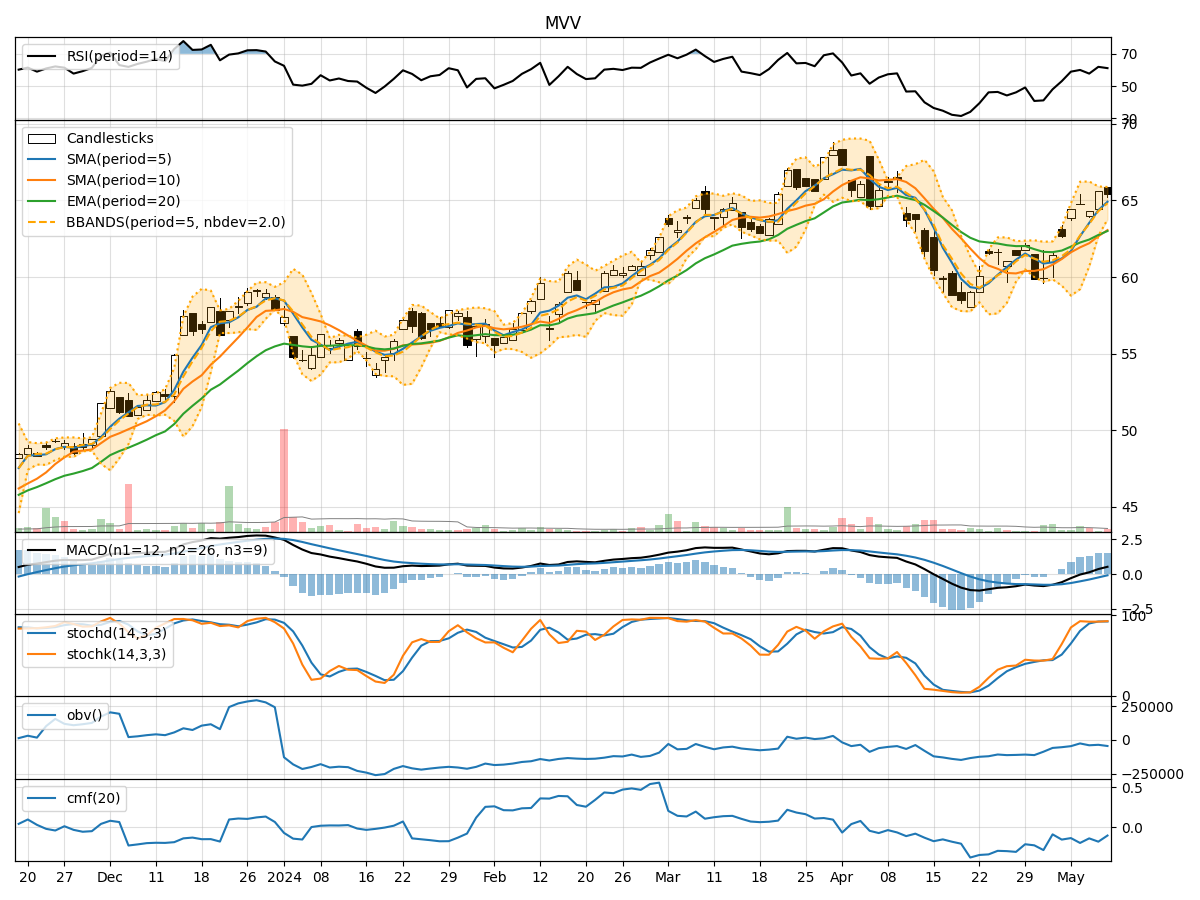
- Moving Averages (MA): The 5-day MA has been consistently below the closing prices, indicating a short-term downtrend.
- MACD: The MACD line has been below the signal line, suggesting a bearish momentum.
- EMA: The EMA has been declining, reflecting a weakening trend.
Key Observation: The trend indicators point towards a bearish sentiment in the stock's price movement.
Momentum Analysis:
- RSI: The RSI has been fluctuating around the 50 level, indicating indecision in the market.
- Stochastic Oscillator: Both %K and %D have been trending lower, signaling a potential oversold condition.
- Williams %R: The indicator has been in the oversold territory, suggesting a possible reversal.
Key Observation: Momentum indicators show a mixed outlook with a slight inclination towards a bullish reversal.
Volatility Analysis:
- Bollinger Bands (BB): The bands have been narrowing, indicating decreasing volatility.
- BB %B: The %B has been hovering around the midline, reflecting a balanced market sentiment.
Key Observation: Volatility indicators suggest a consolidation phase with a neutral bias.
Volume Analysis:
- On-Balance Volume (OBV): The OBV has shown a slight increase, indicating some buying interest.
- Chaikin Money Flow (CMF): The CMF has been positive, suggesting money flow into the stock.
Key Observation: Volume indicators hint at moderate buying pressure in the stock.
Conclusion:
Based on the analysis of trend, momentum, volatility, and volume indicators, the overall outlook for MVV in the next few days is as follows: - Trend: Bearish - Momentum: Mixed with a slight bullish bias - Volatility: Consolidation - Volume: Moderate buying pressure
Final Verdict:
Considering the comprehensive analysis of technical indicators, the next few days for MVV are likely to see a sideways movement with a potential bullish reversal. Traders should closely monitor key support and resistance levels for confirmation of a trend reversal. It is advisable to exercise caution and wait for clearer signals before making significant trading decisions.