Technical Analysis of NFRA 2024-05-31
Overview:
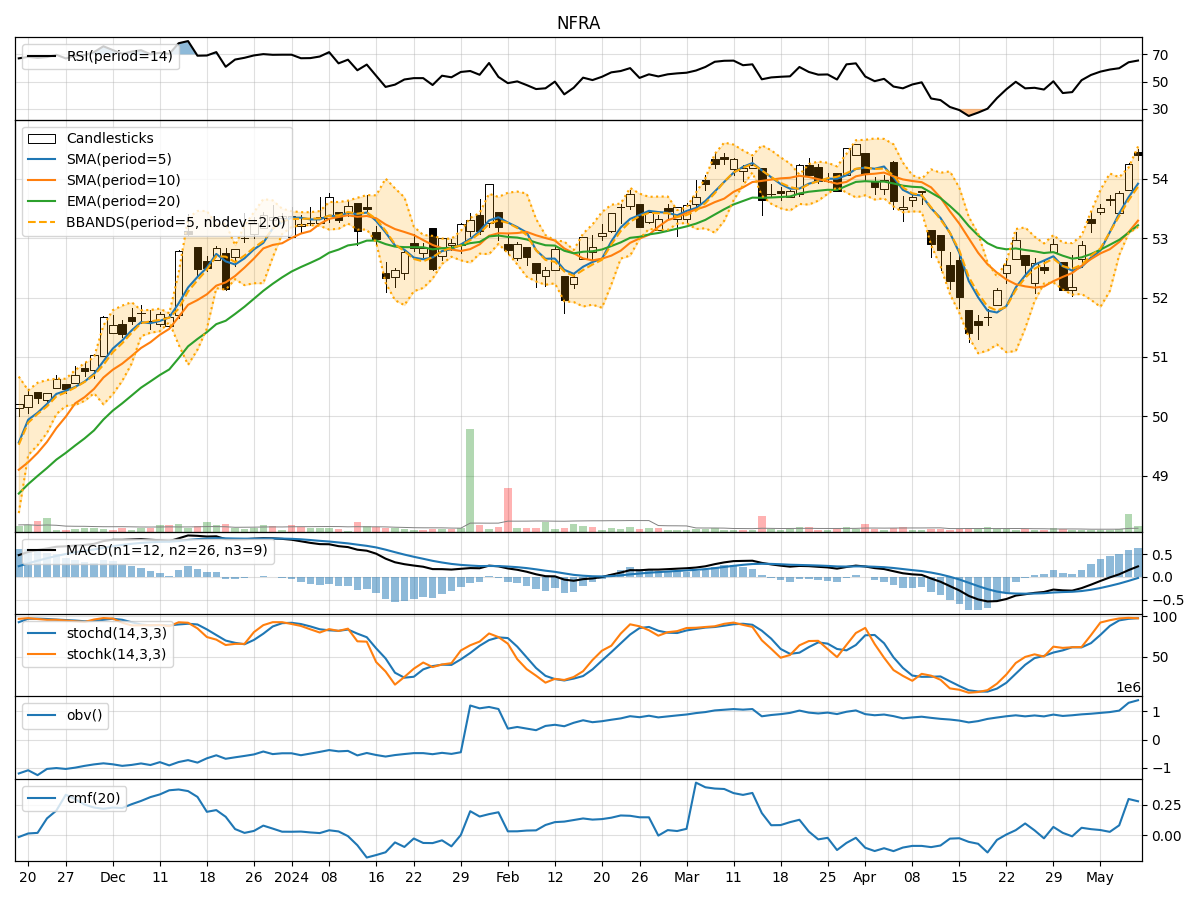
In the last 5 trading days, NFRA stock has shown mixed signals across various technical indicators. The stock price has fluctuated within a certain range, indicating indecision in the market. By analyzing trend, momentum, volatility, and volume indicators, we can gain insights into the potential future price movement of NFRA stock.
Trend Analysis:
- Moving Averages (MA): The 5-day MA has been below the 10-day SMA, indicating a short-term bearish trend. However, the EMA(20) has been relatively stable.
- MACD: The MACD line has been consistently above the signal line, suggesting a bullish momentum.
- Conclusion: The trend indicators show a mixed signal, with a slight bearish bias in the short term.
Momentum Analysis:
- RSI: The RSI has been fluctuating around the neutral 50 level, indicating a lack of strong momentum.
- Stochastic Oscillator: Both %K and %D have been in oversold territory, suggesting a potential reversal.
- Conclusion: Momentum indicators suggest a neutral stance with a slight bullish bias.
Volatility Analysis:
- Bollinger Bands (BB): The stock price has been trading within the bands, indicating normal volatility.
- Conclusion: Volatility indicators suggest a stable price movement with no extreme fluctuations expected.
Volume Analysis:
- On-Balance Volume (OBV): The OBV has shown a slight increase, indicating some buying pressure.
- Chaikin Money Flow (CMF): The CMF has been positive, suggesting money flow into the stock.
- Conclusion: Volume indicators point towards a potential increase in buying interest.
Overall Conclusion:
Based on the analysis of trend, momentum, volatility, and volume indicators, the next few days' possible stock price movement for NFRA is likely to be sideways with a slight bullish bias. The trend indicators show a mixed signal, with a short-term bearish bias, while momentum indicators suggest a neutral stance with a slight bullish bias. Volatility indicators indicate stable price movement, and volume indicators hint at increasing buying interest.
Recommendation:
Considering the overall analysis, it is advisable to monitor the stock closely for any signs of a breakout. Traders may consider setting tight stop-loss levels to manage risk effectively. Long-term investors could use any potential dips as buying opportunities, keeping in mind the overall bullish bias in momentum indicators.
Disclaimer:
Remember that market conditions can change rapidly, and it is essential to conduct thorough research and consider multiple factors before making any investment decisions. Technical analysis provides insights into potential price movements, but it is not a guaranteed predictor of future performance. Consult with a financial advisor for personalized investment advice tailored to your specific financial goals and risk tolerance.