Technical Analysis of NYF 2024-05-31
Overview:
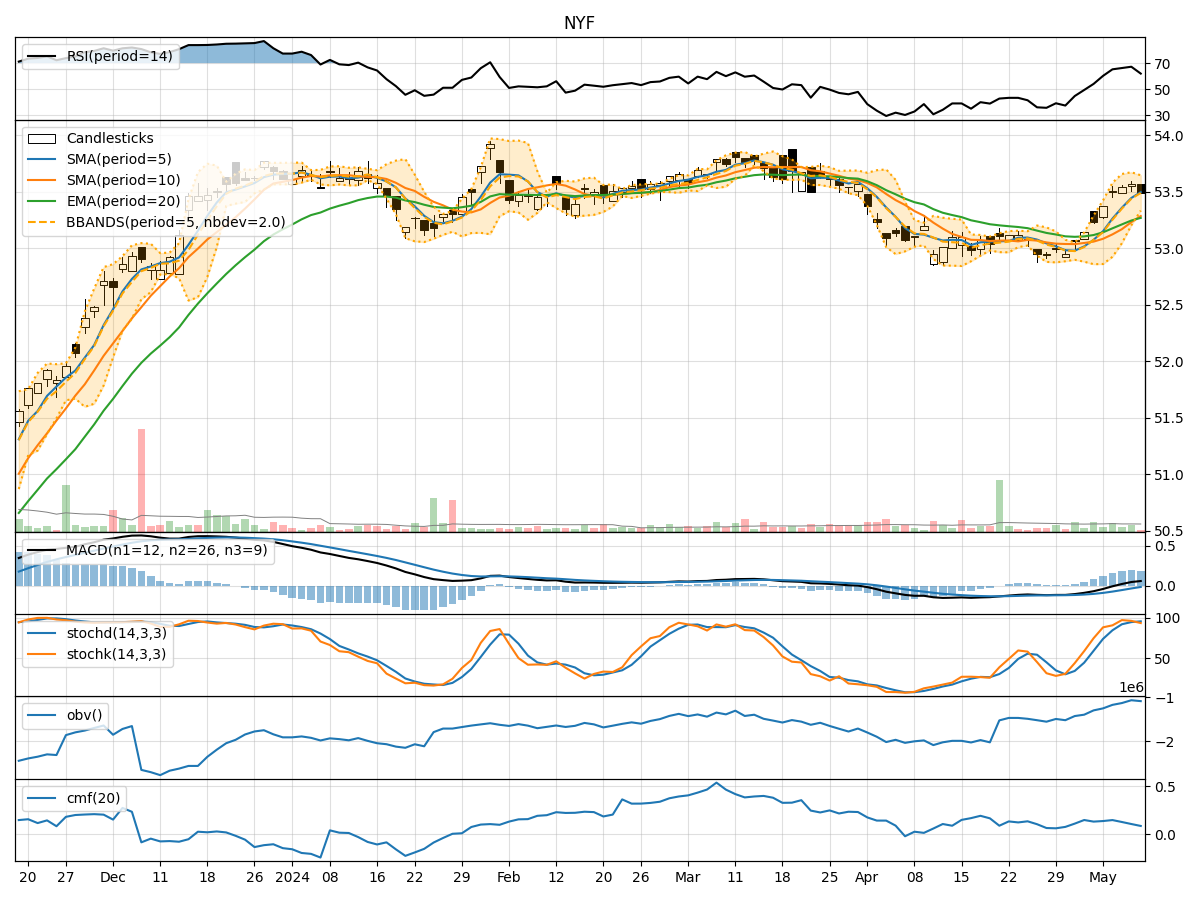
In analyzing the technical indicators for NYF stock over the last 5 days, we will delve into the trend, momentum, volatility, and volume indicators to provide a comprehensive outlook on the possible stock price movement in the coming days. By examining these key indicators, we aim to offer valuable insights and predictions to guide investment decisions.
Trend Analysis:
- Moving Averages (MA): The 5-day MA has been consistently below the closing price, indicating a short-term downtrend.
- MACD: The MACD line has been negative, with the MACD histogram showing a decreasing trend, suggesting bearish momentum.
- EMA: The EMA has been declining, further supporting the bearish trend.
Momentum Analysis:
- RSI: The RSI has been below 50, indicating bearish momentum in the stock.
- Stochastic Oscillator: Both %K and %D have been in oversold territory, signaling a potential reversal or continuation of the downtrend.
- Williams %R: The indicator has been in oversold territory, suggesting a possible bounce in the stock price.
Volatility Analysis:
- Bollinger Bands (BB): The stock price has been trading within the lower Bollinger Band, indicating a potential oversold condition.
- Bollinger Band Width (BBW): The BBW has been narrowing, suggesting a decrease in volatility.
- Bollinger Band %B (BBP): The %B has been below 0.2, indicating a potential oversold condition.
Volume Analysis:
- On-Balance Volume (OBV): The OBV has been declining, reflecting selling pressure in the stock.
- Chaikin Money Flow (CMF): The CMF has been negative, indicating a lack of buying interest.
Conclusion:
Based on the analysis of the technical indicators, the stock is currently in a downtrend with bearish momentum and low volatility. The oversold conditions indicated by the Stochastic Oscillator and Williams %R suggest a potential short-term bounce in the stock price. However, the overall trend remains bearish, supported by the negative MACD and declining EMA.
Recommendation:
Considering the bearish trend and momentum, it is advisable to exercise caution in trading NYF stock. Traders may look for potential short-term buying opportunities following a bounce from oversold levels, but investors should wait for more definitive signs of a trend reversal before considering long-term positions. Monitoring key support and resistance levels along with any developments in market sentiment is crucial for making informed trading decisions.