Technical Analysis of OMFL 2024-05-31
Overview:
In analyzing the technical indicators for OMFL over the last 5 days, we will delve into the trend, momentum, volatility, and volume indicators to provide a comprehensive outlook on the possible stock price movement in the coming days. By examining these key aspects, we aim to offer valuable insights and predictions to guide investment decisions.
Trend Analysis:
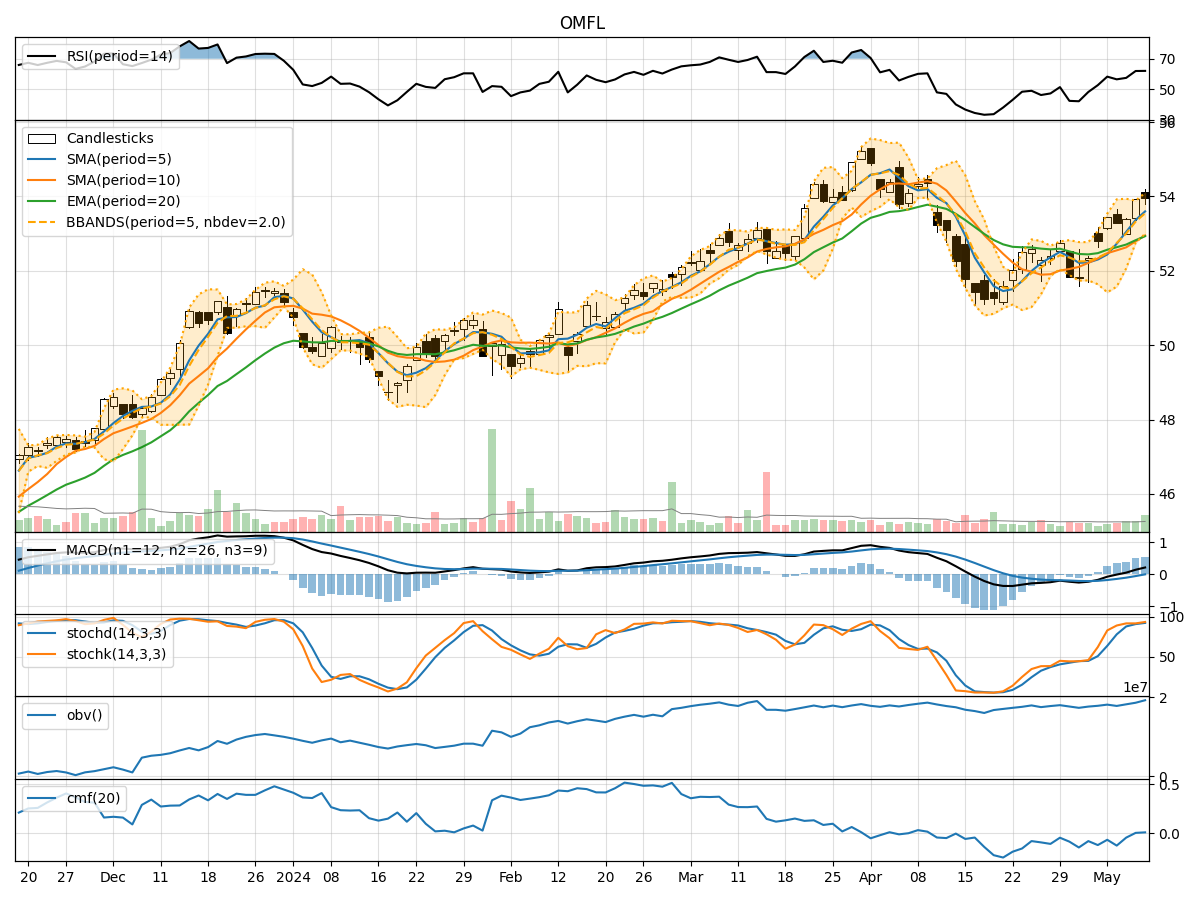
- Moving Averages (MA): The 5-day MA has been fluctuating around the closing prices, indicating short-term price trends. The SMA(10) and EMA(20) have shown a slight decline, suggesting a weakening trend.
- MACD: The MACD line has been positive, but the MACD Histogram has been decreasing, signaling a potential bearish crossover.
- Conclusion: The trend indicators point towards a potential downward movement in the stock price.
Momentum Analysis:
- RSI: The RSI has been fluctuating but is currently in the neutral zone, indicating indecision in the market.
- Stochastic Oscillator: Both %K and %D have been relatively low, suggesting a lack of strong momentum.
- Conclusion: The momentum indicators suggest a sideways movement or a lack of clear direction in the stock price.
Volatility Analysis:
- Bollinger Bands (BB): The stock price has been trading within the bands, with the bands narrowing, indicating decreasing volatility.
- Conclusion: Volatility indicators imply a potential period of consolidation or a decrease in price fluctuations.
Volume Analysis:
- On-Balance Volume (OBV): The OBV has shown mixed movements, indicating uncertainty in the buying and selling pressure.
- Chaikin Money Flow (CMF): The CMF has been positive, suggesting some buying pressure.
- Conclusion: Volume indicators reflect a mixed sentiment in the market, with no clear dominance of buyers or sellers.
Overall Conclusion:
Based on the analysis of trend, momentum, volatility, and volume indicators, the stock price of OMFL is likely to experience further downward movement in the coming days. The trend indicators signal a weakening trend, while momentum indicators suggest a lack of strong direction. Volatility indicators point towards a period of consolidation, and volume indicators indicate mixed sentiment.
Key Recommendations:
- Monitor Closely: Keep a close eye on the trend indicators for any potential reversal signals.
- Wait for Confirmation: Look for clear momentum signals before making any significant trading decisions.
- Consider Risk Management: Given the mixed signals, it is crucial to manage risk effectively and set stop-loss levels accordingly.
Disclaimer:
Remember that market dynamics can change rapidly, and it is essential to stay updated with the latest information and market developments. Always conduct thorough research and consider multiple factors before making investment decisions. Consulting with a financial advisor can provide personalized insights tailored to your specific investment goals and risk tolerance level.