Technical Analysis of ONEQ 2024-05-31
Overview:
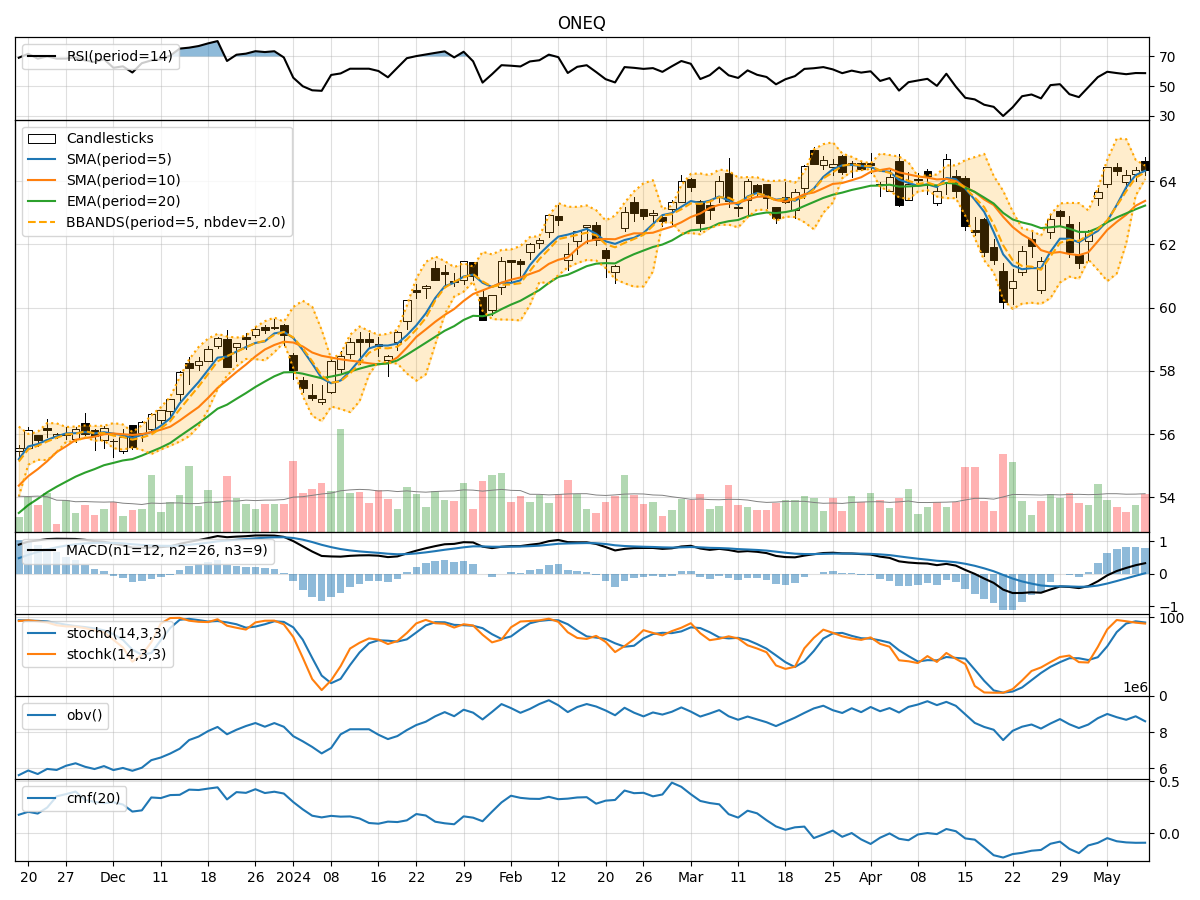
In analyzing the technical indicators for ONEQ over the last 5 days, we will delve into the trend, momentum, volatility, and volume indicators to provide a comprehensive outlook on the possible stock price movement. By examining these key aspects, we aim to offer valuable insights and recommendations for potential future price action.
Trend Analysis:
- Moving Averages (MA): The 5-day MA has been consistently above the closing prices, indicating a short-term uptrend.
- MACD: The MACD line has been above the signal line, suggesting bullish momentum.
- RSI: The RSI has been relatively high, indicating overbought conditions.
Momentum Analysis:
- Stochastic Oscillator: The Stochastic indicators have been fluctuating but are currently in the oversold region.
- Williams %R (WillR): The Williams %R is in the oversold territory, signaling a potential reversal.
Volatility Analysis:
- Bollinger Bands (BB): The stock price has been trading within the upper and lower bands, indicating volatility.
- Average True Range (ATR): The ATR has shown fluctuations, suggesting varying levels of volatility.
Volume Analysis:
- On-Balance Volume (OBV): The OBV has shown mixed signals, with some days seeing positive volume accumulation.
- Chaikin Money Flow (CMF): The CMF has been positive, indicating buying pressure.
Key Observations and Opinions:
- Trend: The trend indicators suggest a short-term uptrend, supported by the moving averages and MACD.
- Momentum: The momentum indicators show mixed signals, with stochastic indicators in oversold territory but RSI indicating overbought conditions.
- Volatility: Volatility has been present, as seen in the Bollinger Bands and ATR.
- Volume: Volume indicators show mixed signals, with OBV showing some accumulation and CMF indicating buying pressure.
Conclusion:
Based on the analysis of the technical indicators, the stock price of ONEQ is likely to experience further upside movement in the next few days. The trend indicators support a bullish view, while momentum indicators suggest a potential reversal from oversold levels. Volatility is expected to persist, providing trading opportunities, and volume indicators hint at underlying buying pressure. Therefore, the overall outlook for ONEQ is bullish in the short term. Investors may consider buying opportunities in anticipation of a potential price increase.